View from the Observation Deck
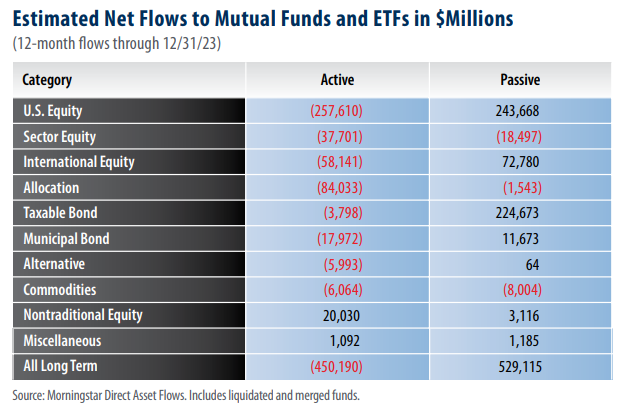
Investors directing capital into mutual funds and exchange traded funds (ETFs) continued to favor passive investing over active management for the 12-month period ended 12/31/23. Passive mutual funds and ETFs reported estimated net inflows totaling $529.12 billion for the 12-month period ended 12/31/23 while active funds reported estimated net outflows totaling $450.19 billion over the same period. The only active categories over the past 12 months with net inflows were Nontraditional Equity and Miscellaneous with inflows of $20.03 billion and $1.09 billion, respectively (see table above). For comparison, the top three passive categories were U.S. Equity, Taxable Bond, and International Equity with inflows of $243.67 billion, $224.67 billion, and $72.78 billion, respectively.
Despite improving total returns throughout much of 2023, equity funds have seen significant outflows over the trailing 12-month period.
Combined, the active and passive equity categories experienced net outflows of $117.93 billion for the 12-month period ended 12/31/23. For comparison, the Taxable and Municipal Bond categories reported net inflows totaling $214.58 billion over the same time frame. The S&P 500, S&P MidCap 400, and S&P SmallCap 600 Indices posted total returns of 26.26%, 16.39% and 15.94% respectively, for the 12-month period ended 12/29/23, according to Bloomberg. With respect to foreign equities, the MSCI Daily TR Net World (ex U.S.) and MSCI Emerging Net TR Indices posted total returns of 17.94% and 9.83%, respectively, over the same period. The U.S. Dollar Index (DXY), which reflects the general international value of the U.S. dollar relative to a basket of major world currencies, fell by 2.11% during the time frame. The weaker dollar accelerated the performance of unhedged foreign securities held by U.S. investors, in our opinion.
Takeaway
Passive mutual funds and ETFs saw inflows of $529.12 billion compared to outflows of $450.19 billion for active funds over the trailing 12-month period ended 12/31/23. In the table above, we observe the largest disparity occurred in the U.S. Equity category, with active shedding $257.61 billion compared to inflows of $243.67 billion for passive funds. Notably, even though global equities surged over the period, net outflows from equity funds stood at $117.93 billion. For comparison, combined fixed income saw inflows of $214.58 billion during the time frame. Nontraditional Equity and Miscellaneous were the only two categories to see inflows among the active management styles. To view the last time we updated this post, please click here.


