View from the Observation Deck
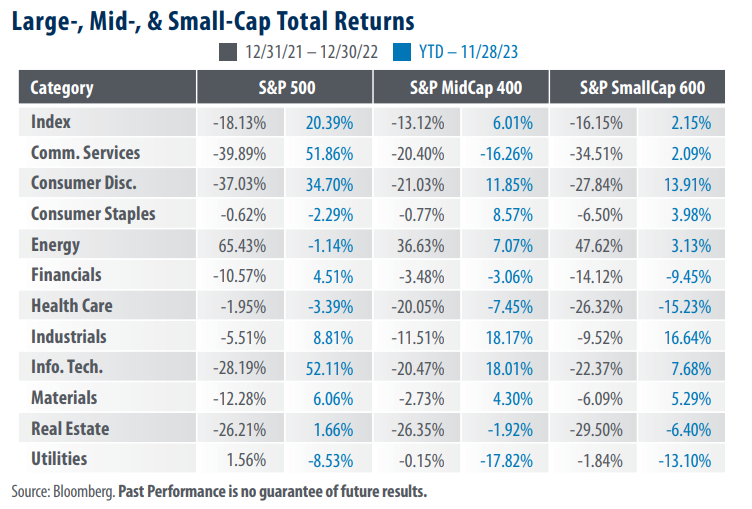
We update today’s table on a regular basis to provide insight into the variability of sector performance by market capitalization. As of the close on 11/28/23, the S&P 500 Index stood 5.04% below its all-time closing high, according to data from Bloomberg. The S&P MidCap 400 and S&P SmallCap 600 Indices stood 12.76% and 20.60% below their respective all-time highs.
• Large-cap stocks, as represented by the S&P 500 Index (“LargeCap Index”), posted year-to-date
(YTD) total returns of 20.39%, significantly outperforming the S&P MidCap 400 (“MidCap Index”)
and S&P SmallCap 600 (“SmallCap Index”) indices, with total returns of 6.01% and 2.15%,
respectively, over the period (see table).
• Sector performance can vary widely by market cap and have a significant impact on overall
index returns. Three of the more extreme cases in 2022 were Health Care, Energy, and Consumer
Discretionary. This year, the Communication Services, Technology, and Energy sectors, to name a
few, reveal a significant variance of returns across market capitalizations (see table).
Technology and communication services stocks, the two top-performing sectors YTD, represented 28.1% and 8.7%, respectively, of the weight of the LargeCap Index at the close of 10/31/23. By comparison, those sectors represented 10.0% and 1.7% of the MidCap Index, and 12.0% and 2.9% of the SmallCap Index, respectively.
• As of the close on 11/28/23, the price-to-earnings (P/E) ratios of the three indices in today’s table
were as follows: S&P 500 Index P/E: 21.05; S&P MidCap 400 Index P/E: 15.57; S&P SmallCap 600 Index P/E: 15.34.
Takeaway
When comparing valuations, mid-cap and small-cap stocks remain attractive compared to their large-cap peers. Over the 10-year period ended 11/28/23, the average monthly P/E ratios for the three indices in today’s table were as follows: S&P 500 Index: 20.62; S&P MidCap 400 Index: 21.34, and S&P SmallCap 600 Index: 25.32, according to data from Bloomberg. As of market close on 11/28/23 the P/E ratios for those indices stood at 21.05, 15.57, and 15.34, respectively. That said, larger companies are often viewed as being more stable during periods of economic turmoil. In our view, despite their stretched valuations, large cap stocks could benefit from investors seeking strength if U.S. economic data deteriorates over the next few quarters.


