View from the Observation Deck
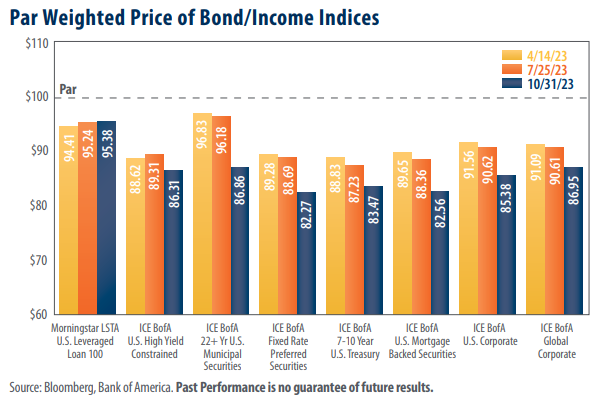
Today’s blog post is intended to provide insight into the movement of bond prices relative to changes in interest rates. For comparative purposes, the dates in the chart are from prior posts we’ve written on this topic.
Each of the eight bond indices we track remain below par value.
In our view, the recent weakness in bond valuations may be reflective of the Federal Reserve’s (“Fed”) tighter monetary policy. The Fed announced a total of 11 increases to the federal funds target rate (upper bound) over the past 19 months, sending the rate soaring from 0.25% where it stood on 3/15/22, to 5.50% as of 11/1/23. As many investors are aware, bond prices and yields typically move in opposite directions. Therefore, an increase or decrease in bond prices could be an indication that yields have fallen or risen, respectively, over the period. While not captured by the time frame in today’s chart, seven of the eight bond indices referenced stood above their par values as of 12/15/21 (Click here to see our post that covers that time frame).
The trailing 12-month rate of change in the Consumer Price Index (CPI) stood at 3.7% as of 9/30/23, down significantly from its most recent peak of 9.1% on 6/30/22, but up from its most recent low of 3.0% on 6/30/23.
While the decrease in the CPI is a welcome relief to bond investors and consumers alike, inflation still hovers above the Fed’s stated goal of 2.0% as well as its 30-year average (through 9/30/23) of 2.5%. Following their policy meeting on 9/20/23, the Fed voted to keep the federal funds target rate unchanged but stated that they may need to hold rates higher for longer to curb rising prices. Whether “higher for longer” leads to further rate hikes remains to be seen, but the announcement does appear to have negatively impacted the prices of fixed income securities. The yields on each of the indices in today’s chart are up (reflecting a decline in prices) since the Fed’s announcement on 9/20/23. At their most recent meeting on 11/1/23, the Federal Open Market Committee voted to keep the federal funds target rate (upper bound) stable at 5.50%. This marks
the second consecutive meeting where they have kept the target rate unchanged.
Takeaway
Good news! With inflation’s recent retreat, all eight of the indices we track in today’s chart currently reflect positive real yields (yield minus inflation). This is welcome news to those investors who are seeking income. That said, the CPI accelerated to 3.7% in September 2023, up from its most recent low of 3.0% set in June. While the Fed is likely watching this metric closely, they have kept the federal funds target rate steady over the past two consecutive meetings. The likelihood of another rate hike is something we think investors would be well served to watch closely. As the chart reveals, the fixed income indices we track have been priced below their par values for some time. Should monetary policy tighten further, we would expect to see further price pressures across this group. Conversely, cuts in the federal funds rate could mean revaluations to the upside.


