View from the Observation Deck
A myriad of factors, including expectations regarding the direction of U.S monetary policy and developments in Artificial
Intelligence (AI), sent the S&P 500 Index (“Index”) surging by 17.37% year-to-date (YTD) through 9/18/23. Eight of the
eleven sectors that comprise the Index are positive YTD over the same period. That said, the Index closed at 4,453.53 on
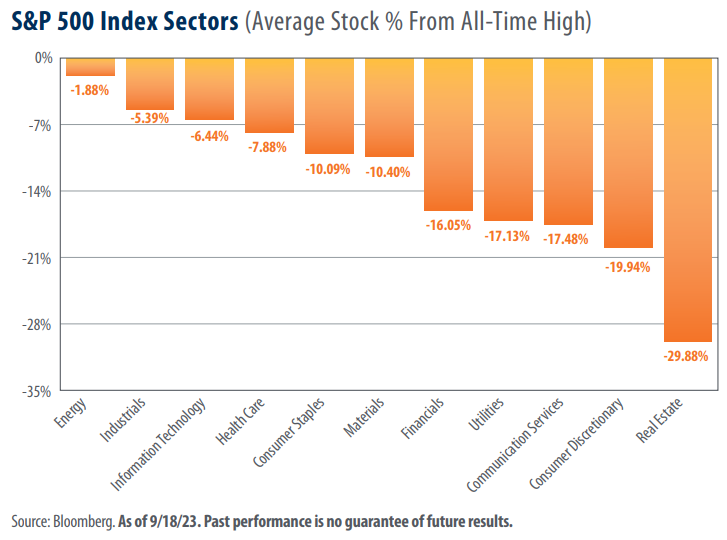
9/18/23, 7.15% below its all-time high of 4,796.56 set on 1/3/22. Where do each of the eleven sectors stand with regards
to their respective all-time highs? This post serves as an update to a recent blog entry (click here for the last time we posted
on this topic).
• As revealed by the chart above, all eleven sectors that comprise the Index sit below their all-time highs as of 9/18/23.
• The Energy sector is closest to its all-time high (-1.88 %), while Real Estate was furthest (-29.88%). Communication
Services and Information Technology, the two top performing sectors in the Index on a YTD basis, stood -17.48% and
-6.44%, respectively, below their all-time highs.
• As of 9/18/23, 284 stocks in the S&P 500 Index (currently 503) had positive returns on a price-only basis in 2023,
according to data from Bloomberg. Those 284 stocks only account for 56.5% of the 503 holdings. For comparison, just
145 stocks in the Index finished the 2022 with positive price returns.
• A Bloomberg survey of 22 equity strategists found that their average year-end price target for the S&P 500 Index
was 4,366 as of 9/18/23, according to its own release. The highest estimate was 4,900, while the lowest was 3,700.
Takeaway
The S&P 500 Index continues to experience a remarkable year thus far in 2023. That said, neither the broader
Index nor any of its eleven sectors have been able to recapture their all-time highs. Even the Communication
Services and Information Technology sectors, which posted total returns of 45.51% and 39.10%, respectively
(YTD through 9/18/23), are substantially below their highs. The most recent Bloomberg survey of equity
strategists revealed an average year-end price target for the S&P 500 Index of 4,366 (22 strategists surveyed).
Notably, this same survey stood at an average of 4,017 just a few short months ago (5/18/23, 23 strategists
surveyed). We’ll leave it to the pundits to debate the day-to-day direction of equity markets. From our
perspective, investors with a long-term view should take comfort in the fact that given enough time, equity
markets have never failed to produce new highs.


