View from the Observation Deck
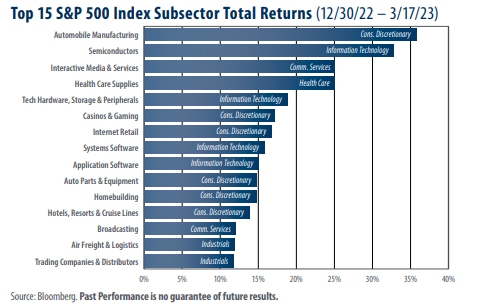
Today’s blog post is for those investors who want to drill down below the sector level to see what is performing well in the stock market. The S&P 500 Index was comprised of 11 sectors and 131 subsectors as of 3/17/23, according to S&P Dow Jones Indices. The 15 top-performing subsectors in the chart posted total returns ranging from 11.68% (Trading Companies & Distributors) to 35.77% (Automobile Manufacturing).
• As indicated in the chart above, 6 of the 15 top-performing subsectors, including the top performing subsector year-to-date (Automobile Manufacturing), came from the S&P 500 Index Consumer Discretionary sector. Information Technology had four subsectors represented, while Communication Services and Industrials each had two subsectors represented. Notably, Energy, which accounted for all four of the top spots the last time we posted on this topic, does not make an appearance in today’s chart. Click here to view our last post on subsector performance.
Bolstered by purchases of long-lasting goods, consumer spending, as measured by personal consumption expenditures, grew by 1.8% month-over-month in January, the largest increase in the metric since March of 2021, according to Reuters. Reuters also noted that sales of motor vehicles increased by 7.1% in January, which may have been a catalyst to the Automobile Manufacturer subsector’s substantial outperformance relative to its peers, in our opinion.
• With respect to the 11 sectors, Technology posted the highest total return for the period captured in the chart, increasing by 15.42%, according to Bloomberg. The second-and third-best performers were Communication Services and Consumer Discretionary, with total returns of 14.86% and 9.43%, respectively. The S&P 500 Index posted a total return of 2.40% for the period.
• As of 3/17/23, the most heavily weighted sector in the S&P 500 Index was Information Technology at 29.02%, according to S&P Dow Jones Indices. For comparison, the Consumer Discretionary and Communication Services sectors had weightings of 10.47% and 8.16%, respectively. • Energy had the lowest estimated year-end price-to-earnings ratio (9.76 as of 2/28) of the 11 sectors that comprise the S&P 500 Index, according to S&P Dow Jones Indices. Financials was a distant second at 13.00. Not including Real Estate, Consumer Discretionary had highest P/E ratio for the sectors that comprise the S&P 500 Index, coming in at 24.99 as of 2/28.
Takeaway
The Consumer Discretionary sector accounts for 6 of the top 15 subsectors, including the top performer, in today’s chart. In our view, January’s better-than-expected consumer spending data and an easing in the chips shortage likely provided a boost to the Consumer Discretionary and Technology sectors at the start of 2023. As we have discussed previously, the health of the consumer may prove to be paramount as it relates to the U.S. economy avoiding recession. There are a growing number of packaged products, such as exchange-traded funds, that feature S&P 500 Index subsectors


