View from the Observation
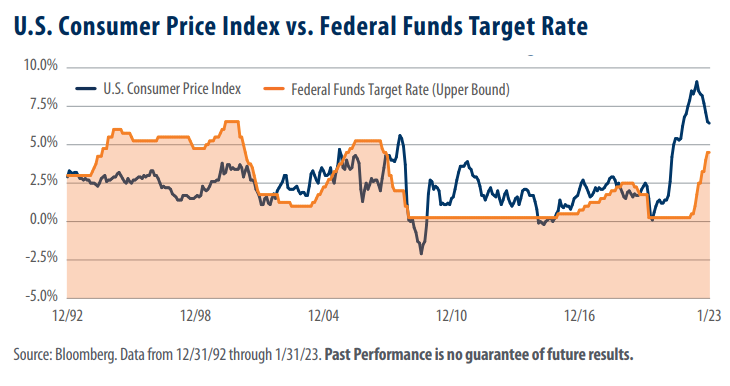
Deck As a result of rising interest rates, many pundits have been touting high yield cash and cash-alternative investments recently. We find it interesting that while the yield paid by these products has risen, the rates they are paying are still not enough to offset inflation. That said, we thought a chart comparing the Consumer Price Index (CPI) to the federal funds target rate (upper bound) over an extended period might lend some perspective to the situation investors are currently facing. Today’s chart compares these two metrics over the 30-year period from 1993 thru January 2023, inclusively.
A significant policy shift occurred during the Great Recession
A brief study of the chart illuminates this point. Out of the 180 months represented in the first half of the chart (1993 – 2007), there were only 40 months where the CPI was higher than the federal funds target rate. Over the next fifteen year period (2008 thru January 2023), that number exploded to 148 of 181 months. This has had a drastic impact on the fixed income markets, in our opinion. For example, total global negative yielding debt fell to $0 on January 4, 2023 for the first time in over a decade. Additionally, many savings and money market accounts are now paying 4% or more, up significantly from near zero at the start of the year, according to the New York Times.
Remember TINA?
As the CPI began to overtake the federal funds target rate, the yield paid to fixed income investors became inadequate to overcome the effects of inflation. From 1993 thru 2007, for example, the yield on the 10-year Treasury note (T-note) and the CPI averaged 5.38% and 2.6%, respectively. In terms of real yield (yield minus inflation), an investor who held the 10-year T-note over that time frame would have received an income stream that was 278 basis points (bps) higher than the rate of inflation on average. By comparison, from 2008 thru January 2023, an investment in the 10-year T-note would have paid a real yield of 1 bps on average! Remember the acronym “TINA” (There Is No Alternative)? Faced with real yields barely above zero, many investors felt there was no alternative to the equity markets if they were to outpace inflation. That said, the yield on the 10-year T-note has increased substantially recently, jumping from 1.51% as of December 31, 2021, to its most recent reading of 3.82% on February 17, 2023. While it is true that rising yields may make fixed income and savings an increasingly attractive alternative to the equity market, we aren’t quite there yet, in our opinion.
Takeaway
For the fifteen years prior to the Great Recession (1993 – 2007), the federal funds target rate was generally higher than the CPI. Notably, that has not been the case over the more recent fifteen-year period. From 2008 to January 31, 2023 (inclusive), the federal funds target rate has been lower than the CPI nearly 82% of the time. In fact, even as recently as February 17, 2023, the CPI still stood above both the federal funds target rate and the yield on the 10-year T-note. In our view, we are not out of the woods yet. Investors may want to note that should the federal funds target rate continue to rise, an increase in fixed income yields is likely. In addition, higher yields could have a negative impact on equity valuations.


