VIEW FROM THE OBSERVATION DECK
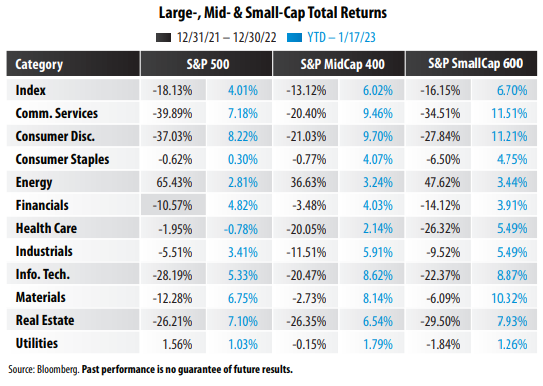
• Small-cap and mid-cap stocks outperformed their large-cap counterpart in 2022 and the trend continues in 2023
To put it bluntly, U.S. mid and small-sized companies offer better valuations than their larger counterpart. The price-to-earnings (P/E) ratios of the S&P Mid-Cap 400 and S&P Small-Cap 600 indices were 14.81 and 15.20, respectively, as of 1/18/23, whereas the P/E ratio of the S&P 500 stood at 19.06. Comparing current P/E’s to their 10-year averages reveals an even larger disparity across market capitalizations. The 10-year average monthly P/E ratios for the indices in today’s table are: 20.31 (S&P 500), 21.74 (S&P MidCap 400) and 26.92 (S&P SmallCap 600). Even with their recent outperformance, mid and small-cap companies continue to offer incredible value, in our opinion.
• Sector performance can vary significantly by market cap
Technology stocks, which were the third-worst performing sector in 2022, made up more than 26% of the weight of the S&P 500 Index as of 1/18/23. For comparison, information technology comprised just over 12% and 13% of the MidCap and SmallCap indices, respectively. Similarly, the S&P 500 Index Health Care sector performed relatively well in 2022, but its mid-cap and small-cap counterparts suffered significant losses over the period (see the table above).


