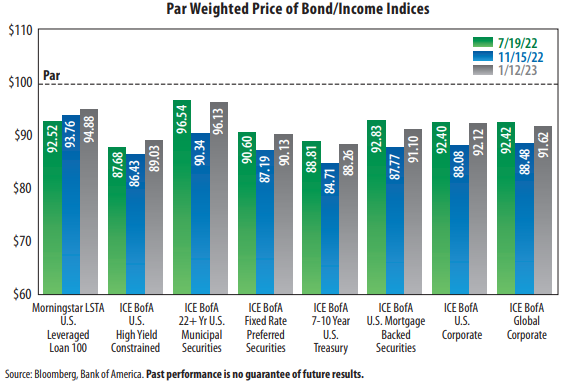
This chart is intended to provide an update on bond prices, which are typically sensitive to changes in interest rates.
The dates in the chart are from prior posts.
• All eight of the indices represented in the table show price improvements since 11/15/22
The Federal Reserve (“Fed”) remained steadfast in its commitment to battle inflation in 2022, raising the federal
funds rate (upper bound) from 0.25% (where it stood in March) to 4.50% in December. Bond yields, which can be
sensitive to interest rate movement, increased in response. This was reflected in price declines (bond yields and
prices move inversely) in seven of the eight indices, as can be seen in the chart from mid-July to mid-November.
Conversely, bond prices recovered during the mid-November to mid-January time period. The Consumer Price Index
(CPI), a common indicator of inflation, fell from 7.7% at the end of October to 6.5% at December’s end, giving some
investors reason to believe that the Fed might reverse its policy of monetary tightening. The next Fed policy
meeting regarding the federal funds rate is scheduled for February 1, 2023.
• Negative real yields (yield minus inflation) persist
As mentioned in our blog post from 1/10/23, most government bonds continue to pay negative real yields. Despite the recent rally in bond prices, investors should be aware
that if inflation remains elevated above the Fed’s 2% target, bond valuations could be pushed lower. As of 1/12/23 only three of the indices in the chart have positive real
yields. They are: the Morning


