View from the Observation Deck
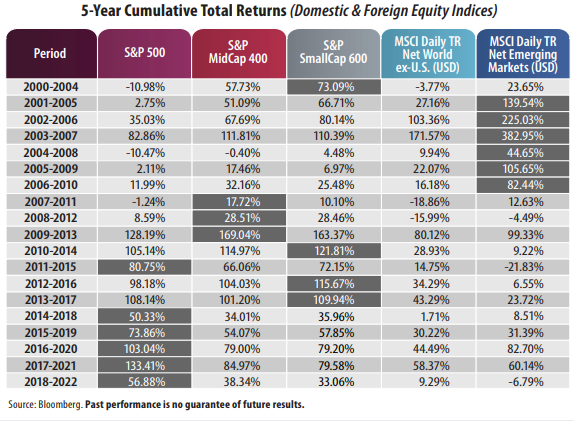
1. Today's blog post features the cumulative total return performance of five major equity indices (three domestic and two foreign) since the start of 2000.
2. We chose to highlight rolling 5-year periods because equity investors have endured two severe and lengthy bear markets (20% or more price decline from recent peak) and a quick one in 2020 due to the onset of COVID-19, since the start of 2000. Investors have also weathered a significant number of challenging global events since 2000.
3. We also like to occasionally remind investors that the buy and hold strategy can still serve them well over time.
4. The three bear markets in stocks (not including the current bear market) ran from 3/24/00-10/9/02, 10/9/07-3/9/09, and 2/19/20-3/23/20 as measured by the S&P 500 Index. During those time periods, the S&P 500 Index posted total returns of -47.38%, -55.22% and -33.79%, respectively, according to Bloomberg.
5. Here are just a few of the challenging global events we alluded to: 9/11 terrorist attacks in U.S. (2001); Invasion of Iraq/2nd Gulf War (2003); U.S./Global financial crisis (2008-2009); Greek debt crisis (2009); U.S. stock market flash crash (2010); Japan's tsunami/9.0 earthquake (2011); the UK's decision (Brexit vote) to leave the European Union (2016); the COVID-19 pandemic (February 2020 to present) and the ongoing war between Russia and Ukraine, which began in February 2022.
6. Emerging markets equities clearly performed the best in the first decade covered in the table, but have underperformed the U.S. indices since.
7. Large-, mid- and small-capitalization (cap) stocks in the U.S. have shared the spotlight dating back to 2007, with large-caps (S&P 500 Index) dominating all five of the last 5-year rolling periods.
8. A weaker U.S. dollar can boost returns for U.S. investors holding positions in unhedged foreign securities, and vice versa. From 2000-2009, the U.S. Dollar Index declined by 23.57% − a nice tailwind for foreign holdings, according to Bloomberg. From 2010-2019, the index appreciated by 23.80% − a notable headwind for foreign holdings. From 2020-2022, the index rose 7.40% to a reading of 103.52, well above its 20-year average reading of 88.53.
9. From 12/31/99-12/30/22, the average annual total returns for the five equity indices were as follows (not shown in table): 6.26% (S&P 500); 9.18% (S&P MidCap 400); 9.23% (S&P SmallCap 600); 3.16% (MSCI Daily TR Net World ex-U.S. in USD); and 5.41% (MSCI Daily TR Net Emerging Markets in USD), according to Bloomberg.


