View from the Observation Deck
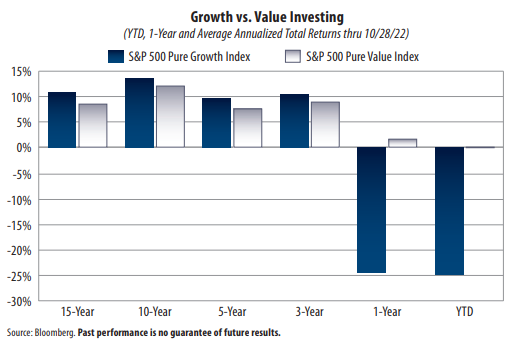
1. We update this post every few months so that investors can see which of the two styles (growth or value) are delivering the better results.
2. The most recent results show that value stocks have significantly outperformed growth stocks on a 1-year and year-to-date basis.
3. Having said that, the S&P 500 Pure Growth Index outperformed its value counterpart in four of the six periods featured in the chart above.
4. The total returns through 10/28/22 were as follows (Pure Growth vs. Pure Value): 15-year avg. annual (10.71% vs. 8.50%); 10-year avg. annual (13.65% vs. 12.07%); 5-year avg. annual (9.56% vs. 7.55%); 3-year avg. annual (10.32% vs. 8.90%); 1-year (-24.77% vs. 1.58%); and year-to-date (-25.21% vs. -0.11%).
5. As of 9/30/22, the largest sector weighting in the S&P 500 Pure Growth Index was Information Technology at 35.6%, according to S&P Dow Jones Indices. The largest sector weighting in the S&P 500 Pure Value Index was Financials at 31.1%.
6. From 12/31/21 through 10/28/22, the S&P 500 Information Technology Index posted a total return of -25.08%, compared to -11.17% for the S&P 500 Financials Index, according to Bloomberg. The S&P 500 Index was down 17.10% over the same period.
7. At a combined weighting of 27.3%, the S&P 500 Pure Value Index's exposure to Energy, Consumer Staples and Utilities was significantly higher than the 10.0% combined weighting in the S&P 500 Pure Growth Index as of 9/30/22, according to S&P Dow Jones Indices. They are the three best-performing sectors so far in 2022.
8. From 12/31/21 through 10/28/22, the S&P 500 Energy, Consumer Staples and Utilities Indices posted total returns of 67.01%, -3.26% and -3.71%, respectively, according to Bloomberg.
9. Value stocks have tended to outperform growth stocks when the yield on the benchmark 10-year Treasury note (T-note) rises, and vice versa. For the 12-month period ended 10/28/22, the yield on the 10-year T-note rose 244 basis points to 4.02%, according to Bloomberg.


