View from the Observation Deck
1. Year-to-date through 9/16/22, the S&P 500 Index was down 17.80% on a total return basis. The question is: Could robust inflation and rising interest rates pose even more of a threat to the broader stock market (S&P 500 Index) if sustained?
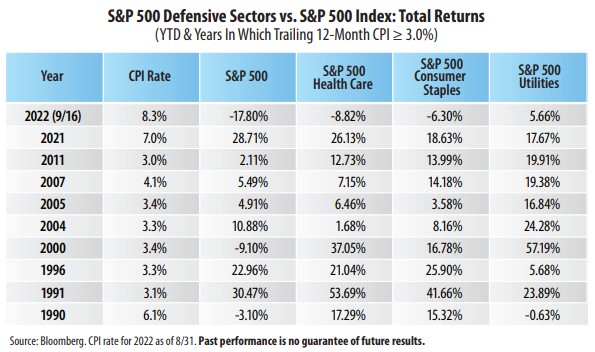
2. We looked back to 1990 and selected those calendar years where inflation, as measured by the Consumer Price Index (CPI), rose by 3.0% or more on a trailing 12-month basis.
3. Why 3.0%? From 1926-2021, the average CPI rate was 3.0%, according to data from the Bureau of Labor Statistics.
4. For comparative purposes, we selected three defensive sectors (Health Care, Consumer Staples, and Utilities) to see how their returns matched up with those of the S&P 500 Index.
5. The premise is that defensive sectors tend to be less cyclical in nature than their counterparts and can potentially offer investors better performance results in volatile markets.
6. As indicated in the chart, these defensive sectors posted a good showing relative to the S&P 500 Index overall, and all three outperformed the broader market in 1990, 2000, 2007, and 2011.
7. While all three of the defensive sectors are outperforming the S&P 500 Index so far this year, Health Care and Consumer Staples have significantly lagged Utilities (see table).
8. From 12/29/89-9/16/22 (period captured in the table above), the average annualized total returns posted by the four equity indices in the table were as follows (best to worst): 11.70% (S&P 500 Health Care); 10.56% (S&P 500 Consumer Staples); 9.85% (S&P 500); and 8.57% (S&P 500 Utilities), according to Bloomberg.


