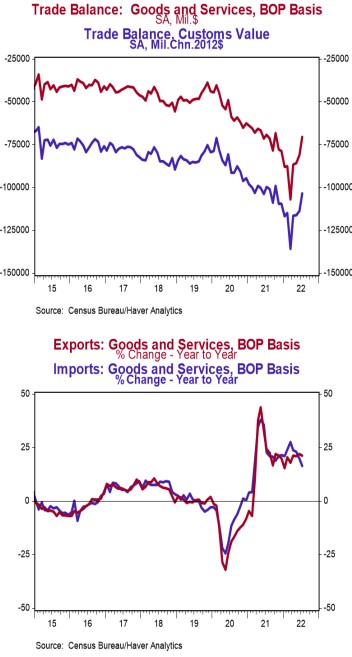
- The trade deficit in goods and services came in at $70.7 billion in July, slightly larger than the consensus expected $70.2 billion.
- Exports rose by $0.5 billion, led by nonmonetary gold, autos, and crude oil. Imports declined by $9.7 billion, led by pharmaceuticals and toys, games, & sporting equipment.
- In the last year, exports are up 21.1% while imports are up 16.4%.
- Compared to a year ago, the monthly trade deficit is $1.3 billion larger; after adjusting for inflation, the “real” trade deficit in goods is $3.6 billion larger than a year ago. The “real” change is the trade indicator most important for measuring real GDP.
Implications:
The trade deficit in goods and services came in at $70.7 billion in July, as imports fell steeply and exports rose modestly, continuing to narrow the deficit from March’s record $106.9 billion print. Because of that huge trade deficit earlier this year, trade was a major drag on first-quarter GDP growth; imports grew rapidly as companies aggressively built up inventories due to fragile supply chains and what looked like unwavering demand from the US consumer. The massive and artificial government stimulus in the US, both fiscal and monetary, and the slow reopening of the economy over the past few years had changed consumer spending habits to focus more on goods than services. That has now reversed and consumers have shifted back towards services and less on goods, leaving many companies with excess inventories. This means we could continue to see imports slow over the next few months. For instance, in today’s report, inbound shipments of consumer goods plummeted 9.8%, the largest drop as far back as data go to 1992! At the same time, international demand has been on the rise, and that was reflected in rising export activity again in July. We like to follow the total volume of trade (imports plus exports), which signals how much businesses and consumers interact across the US border. That measure declined by $9.2 billion in July but is still up a robust 18.4% versus a year ago. Unfortunately, these massive numbers are driven not only by more demand for goods and services but also higher prices as inflation has soared. In addition, Russia’s invasion of Ukraine, and COVID restrictions in China may affect trade patterns for some time. Supply-chain problems are still a big issue as ports remain overwhelmed in the US, and the tragic war in Ukraine is only adding to the problem. For example, the ports of Los Angeles and Long Beach currently have 11 container ships waiting to be unloaded. Although this is near recovery lows, it’s still above the 0 - 1 normal level experienced pre-COVID and, in some cases, waits have just shifted to other ports. Also notable in today’s report, the dollar value of US petroleum imports exceeded exports. However, that follows four consecutive months of exports exceeding imports. Where we go from here on that balance may depend on federal leasing policy over the next few years.


