View from the Observation Deck
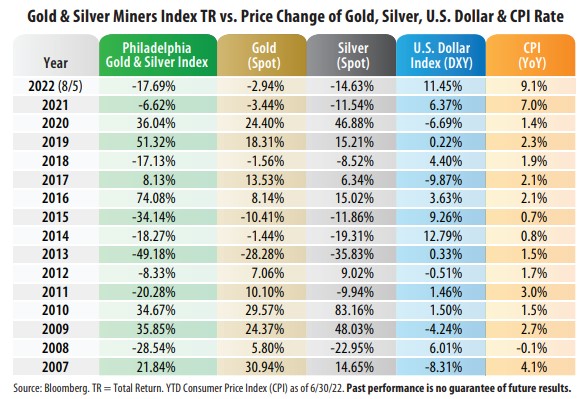
1. Today's blog post illustrates the wide disparities that often exist between the annual price performance of an ounce of gold bullion, silver and the equity returns posted by the mining companies.
2. Since precious metals tend to be priced in U.S. dollars, investors should also be aware of the relative strength of the U.S. dollar against other major global currencies, in our opinion.
3. Precious metals have historically been considered potential inflation hedges by investors, although that has not been the case so far in 2022 (see Point 7). From 1926-2021, the CPI rate averaged 3.0%, according to data from the Bureau of Labor Statistics. It stood at 9.1% on a trailing 12-month basis in June 2022.
4. As of 8/5/22, the price of gold closed trading at $1,775.50 per ounce, according to Bloomberg. The all-time closing high for the spot price is $2,060.59 per ounce, set on 8/6/20.
5. From 2007 through 2021, the Philadelphia Stock Exchange Gold & Silver Index only posted a positive total return in seven of the 15 calendar years, but four of them occurred from 2016 through 2020. It is in negative territory YTD.
6. As of 8/8/22, Bloomberg's earnings per share figures (in dollars) for 2019, 2020 and 2021 (actual earnings) and consensus estimated earnings per share for 2022 and 2023 for the Philadelphia Stock Exchange Gold & Silver Index were as follows: $1.00 (2019); $4.62 (2020); $5.63 (2021); $6.42 (2022 Est.); and $7.27 (2023 Est.).
7. The price of gold and gold mining stocks succumbed to the simultaneous rise in Treasury bond yields and the strengthening of the U.S. dollar between mid-April through mid-July, according to Barron’s. The selloff in the stock market over that period more than likely put additional downward pressure on gold mining stocks, in our opinion. Bond yields and the U.S. dollar have fallen in recent weeks and stocks have rebounded. Stay tuned.


