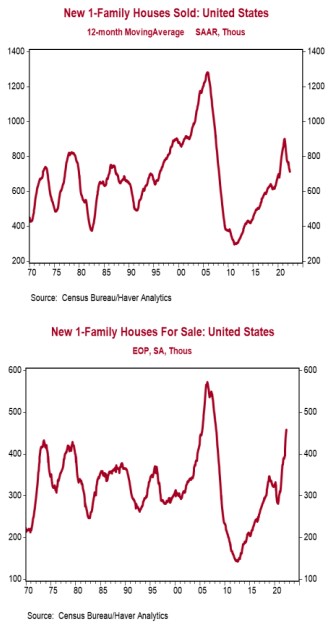
- New single-family home sales declined 8.1% in June to a 0.590 million annual rate, below the consensus expected 0.655 million. Sales are down 17.4% from a year ago.
- Sales in June fell in the West, Northeast and South, but rose in the Midwest.
- The months’ supply of new homes (how long it would take to sell all the homes in inventory) rose to 9.3 in June from 8.4 in May. The gain was due to both a slower pace of sales and a 10,000 unit increase in inventories.
- The median price of new homes sold was $402,400 in June, up 7.4% from a year ago. The average price of new homes sold was $456,800, up 5.8% versus last year.
Implications:
New home sales dropped to the slowest pace in more than two years in June, signaling that declining affordability continues to dissuade buyers. While rapidly rising prices have been an issue in the housing market throughout the COVID-19 pandemic, 30-year mortgage rates now sit just below 6%, adding to the burden. Assuming a 20% down payment, the change in mortgage rates and home prices just since December amount to a 32% increase in monthly payments on a new 30-year mortgage for the median new home. No wonder sales have slowed down! That said, it looks like buyers are beginning to get some relief on median prices, which have fallen two months in a row and are now the lowest since June 2021. The big problem with median prices over the past few years has been a shortage of completed options for buyers. It's true that overall inventories have been rising and currently sit at the highest levels since 2008. However, until recently almost all this inventory gain had come from homes where construction has either not yet started or is still underway. Now a combination of more single-family homes being completed and rising cancellation rates on purchases, due to higher monthly payments, has resulted in notable improvements in the inventory of completed homes. The combination of more completed supply on the market and less demand due to higher mortgage rates has helped bring year-over-year median price growth down from a peak 24.2% in August 2021 to 7.4% in June. Evidence of a slowdown in median price growth is also beginning to show up in other national home price data. For example, the national Case-Shiller index increased 1.0% in May and is up 19.7% from a year ago, a deceleration from its peak of 20.6% in April. The 1.0% gain in June was the smallest gain for any month since July 2020. The price gains in the past twelve months were led by Tampa, Miami, and Dallas, with the slowest price gains in Chicago, Washington, DC, and Minneapolis. The FHFA index, which measures prices for homes financed with conforming mortgages, increased 1.4% in May and is up 18.3% from a year ago, also down from its peak earlier this year. Look for further national price gains in the remaining months of 2022, but at a much slower pace. Prior price gains plus higher mortgage rates will be significant headwinds for further price gains in the next few years. Finally, the Richmond Fed index, a measure of mid-Atlantic manufacturing sentiment, rose to 0 in July versus -9 in June.


