View from the Observation Deck
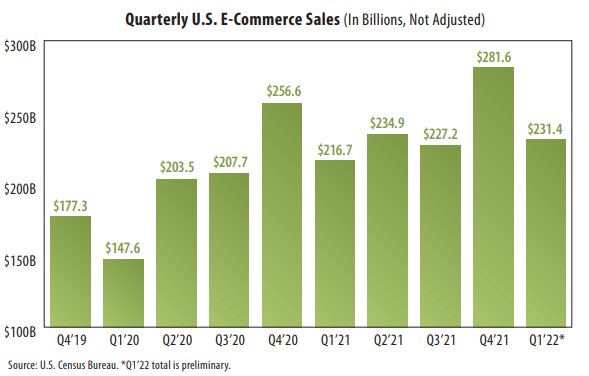
1. Ecommerce sales in the U.S. have flourished throughout the COVID-19 pandemic (Q2’20-Q1’22).
2. Quarterly sales surpassed the $200 billion mark for the first time in Q2’20, according to data from the Census Bureau. Sales surpassed the $100 billion mark for the first time in Q4’15 (not in chart).
3. When you compare the sales figures in the chart using the same calendar quarter (Q4’19 vs. Q4’20 vs. Q4’21) you will notice that all are trending higher on a year-over-year basis. Fourth quarter sales tend to be the highest on an annual basis due to the holiday shopping season.
4. In 2021, total U.S. ecommerce sales reached $960.4 billion. In 2022, sales are expected to surpass the $1 trillion mark for the first time ever. Insider Intelligence estimates that online sales will reach $1.05 trillion by year-end.
5. Ecommerce sales (not adjusted) as a percentage of total U.S. retail sales stood at 14.3% in Q1’22, up from 12.3% in Q4’19. The all-time high for this figure was 16.6%, set in Q4’20, according to data from the Census Bureau.
6. While ecommerce stocks are down far more than the broader stock market this year, they significantly outperformed the S&P 500 Index over the past 10 years. Year-to-date through 7/22/20, the Dow Jones Internet Commerce Index posted a total return of -44.64%, compared to -16.17% for the S&P 500 Index, according to Bloomberg. From 7/20/12 through 7/22/22, the 416.13% cumulative total return on the Dow Jones Internet Commerce Index was nearly two-thirds (64%) higher than the 253.65% gain generated by the S&P 500 Index.


