View from the Observation Deck
1. This marks the 11th calendar year in which we have tracked the asset growth of the four major types of packaged products since the close of 2007 (prior to financial crisis in 2008-2009).
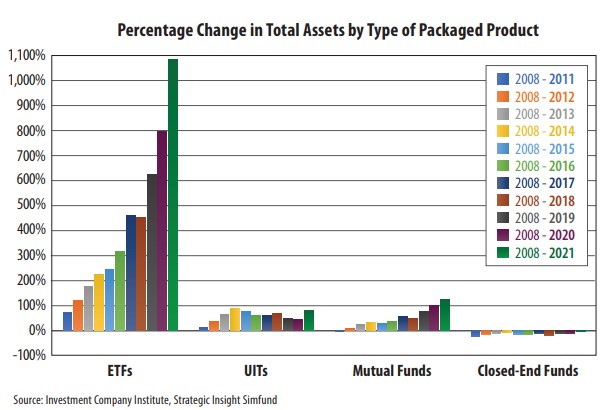
2. The percentage change in the total assets invested in packaged products from 2008 to 2021 were as follows (see chart): Exchange-Traded Funds (ETFs) (+1,083%); UITs (+79%); Mutual Funds (+125%); and Closed-End Funds (-2%).
3. From 2020 to 2021, total assets in each of the four major types featured in the chart fluctuated as follows: ETFs ($5.45 trillion vs. $7.19 trillion); UITs ($78 billion vs. $95 billion); Mutual Funds ($23.9 trillion vs. $27.0 trillion); and Closed-End Funds ($279 billion vs. $309 billion).
4. With respect to mutual funds, while we do not yet have the figures for 2021, data from the Investment Company Institute indicates that assets held in Passive (Index) funds rose 462% from 2008 through 2020, while Active fund assets increased just 83%. This clearly shows that passive investing is driving the growth in mutual fund assets.
5. Investors once again favored passive investing over active management in 2021, according to data from Morningstar. Its data shows that estimated net flows to all Active long term mutual funds and ETFs totaled $250.0 billion, while estimated net flows to all Passive funds and ETFs totaled $958.4 billion.
6. There is no doubt that passive investing continues to drive demand for packaged products.


