View from the Observation Deck
1. “Buy the dip!” That is what bullish investors and pundits sometimes say when the major stock indices, such as the S&P 500 Index, drop a few percentage points from their most recent highs.
2. Sometimes buying the dip works, and sometimes the dip devolves into a correction or bear market.
3. A correction is defined as a 10.00% to 19.99% decline in the price of a security or index from its recent peak. A bear market involves a price decline of 20% or more.
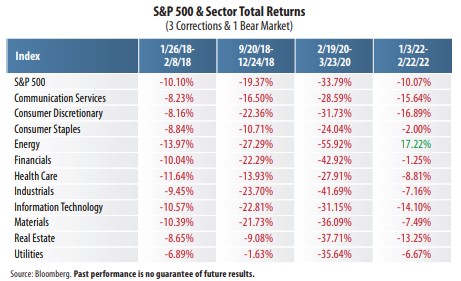
4. As indicated in the table above, the S&P 500 Index is currently experiencing a correction (based on its closing price on 2/22/22). Since the start of 2018, the index has endured three corrections and one bear market, which can largely be attributed to the COVID-19 pandemic, in our opinion.
5. From 1946 through 2019, there were 26 market (S&P 500 Index) corrections, according to data from Goldman Sachs and CNBC. The average decline was 13.7%, and the average amount of time needed to recover the losses sustained was about four months.
6. There were 12 bear markets over that same period. The average decline was 32.5%, and the average amount of time needed to recover the losses was approximately 24 months.
7. The S&P 500 Index stood at an all-time closing high of 4,796.56 on 1/3/22. That statistic says it all. It reminds investors that the S&P 500 Index has never failed to fully recover from a correction or bear market.
8. The inherent checks and balances of the stock market work over time. When investors believe that stocks are overvalued there will likely be more sellers than buyers at some point and vice versa


