View from the Observation Deck
1. The yield on the 10-year Treasury note (T-note) closed at an all-time low of 0.51% on 8/4/20, according to Bloomberg.
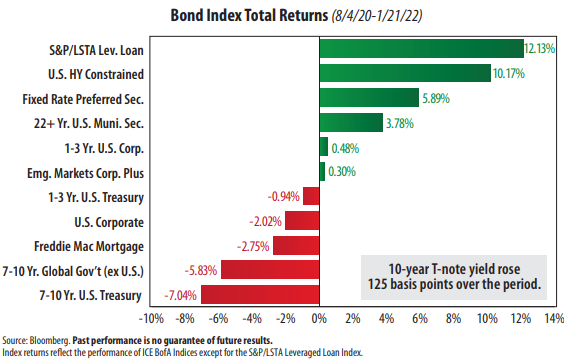
2. From 8/4/20 through 1/21/22, its yield rose from 0.51% to 1.76%, or an increase of 125 basis points. Its closing high for the period was 1.88%, set on 1/18/22.
3. As indicated in the chart above, the worst-performing bond categories for the period all track high-grade debt.
4. Since 8/4/20, investors have favored speculative-grade bonds over investment-grade debt, as evidenced by the strong total returns posted by leverage loans
(senior loans) and high yield corporate bonds.
5. Emerging market bonds eked out a positive total return for the period captured in the chart, but intermediate-term global government bonds were in negative
territory (see chart). The U.S. Dollar Index (DXY) rose by 2.42% over the same period, according to Bloomberg. That gain is enough to provide a bit of a drag on
the returns on foreign bonds, in our opinion.
6. Inflation has surged. The trailing 12-month CPI (Consumer Price Index) stood at 7.0% in December 2021, a level not seen since March 1982, according to data
from the Bureau of Labor Statistics.
7. Investors funneled an estimated net $531.52 billion into Taxable Bond mutual funds and exchange-traded funds (ETFs) and $106.28 billion into Municipal
Bond funds and ETFs for the 12-month period ended 12/31/21, according to Morningstar. Total assets held by Taxable and Municipal Bond funds stood at
$5.61 trillion and $1.06 trillion, respectively, on 12/31/21.


