View from the Observation Deck
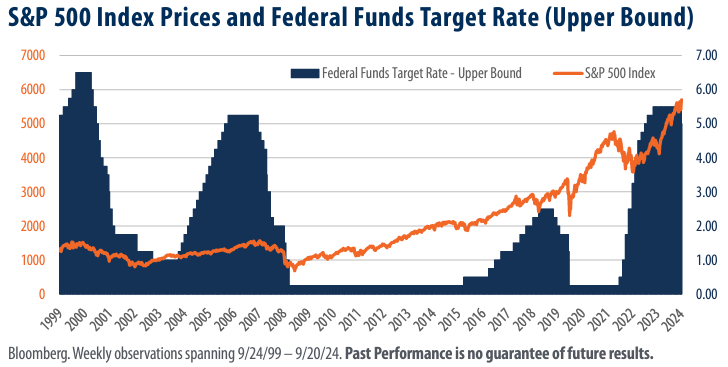
The Federal Reserve (“Fed”) voted to cut interest rates by 50 basis points at its meeting last week, lowering the federal funds target rate (upper bound) from 5.50% to 5.00%. The decision was highly anticipated and marks the first reduction to the federal funds target rate since March 15, 2020. In today’s post, we review the price of the S&P 500 Index (“Index”) during previous rate cut environments and set out to determine what factors may have impacted equity valuations during those time frames. To do so, we charted the price return of the Index alongside the federal funds target rate (upper bound) over the 25-year period ended September 24, 2024.
There were three previous cycles where the Fed reduced its policy rate in today’s chart (not including the most recent reduction). As the chart reveals, the Index’s price declined over each time frame.
The Index’s total return over the period spanning the first to the last rate cut of each cycle was as follows: Index total return (1/3/01 – 6/25/03): -24.82% Index total return (9/18/07 – 12/16/08): -38.16% Index total return (7/31/2019 – 3/13/20): -7.86% The U.S. economy experienced significant, but unique headwinds throughout each of these reduction cycles. In 2001, the U.S. equity markets, already ailing from the bursting of the dot com bubble, came to a standstill as terrorists attacked on 9/11. In 2007, the “Great Recession” took root, its genesis found in the collapse of sub-prime mortgages. Then there was the global pandemic, which began in 2019, effectively halting all non-essential economic activity.
Notably, earnings for the companies that comprise the Index declined during these three periods.
2000, actual Index earnings totaled $55.70, according to data from Bloomberg. By 2002, actual earnings had declined to $40.49, and would not increase above $55.70 until 2004. A similar pattern emerged over the next rate cut cycle. Index earnings plummeted from $94.34 in 2007 to $58.25 in 2009. They would not fully recover until 2011. While COVID’s impact on the equity markets was short-lived, earnings once again offer a reliable proxy to the Index’s return. Actual earnings reported by the companies in the Index totaled $163.57, $142.80, and $198.22 in 2019, 2020, and 2021, respectively.
Takeaway
We maintain that earnings and revenue growth are fundamental to higher equity valuations (click here to view our recent post on this topic). As of September 20, 2024, Bloomberg’s 2024 and 2025 earnings growth estimates for the Index stood at 9.34% and 14.34%, respectively. Very healthy, in our opinion. Despite these estimates, economic headwinds have materialized. In August, the Bureau of Labor Statistics reported that the U.S. added 818,000 fewer jobs than originally forecast over the 12-month period from April 2023 to March 2024. The news came on the heels of lackluster employment data in July as well. Given that The U.S. derives nearly two-thirds of GDP from consumer spending, an increase in the unemployment rate could threaten economic growth and may be one of the motivations for last week’s rate cut. Earnings estimates could be adjusted lower should the economy falter and companies suffer declining revenues. That said, if earnings estimates hold and economic growth continues, we believe equities stand to benefit.


