View from the Observation Deck
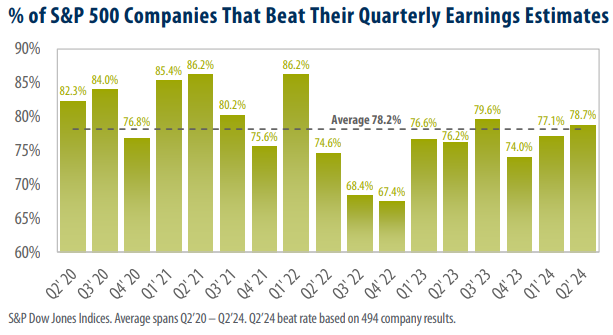
We update this post on an ongoing basis to provide investors with insight into the earnings beat rate for the companies that comprise the S&P 500 Index (“Index”). Equity analysts adjust their corporate earnings estimates higher or lower on an ongoing basis. While these estimates may provide a view into the expected financial performance of a given company, they are not guarantees. From Q2’20 through Q2’24 (the 17 quarters in today’s chart), the average earnings beat rate for the companies that comprise the Index was 78.2%.
As of 8/30/24, the sectors with the highest earnings beat rates and their percentages were as follows: Financials (87.1%); Health Care (85.7%); and Industrials (81.8%), according to S&P Dow Jones Indices. Real Estate had the lowest beat rate at 67.7%. The Real Estate sector also had the highest earnings miss rate (29.0% during the quarter).
As indicated in today’s chart, the percentage of companies in the Index that reported higher than expected earnings in Q2’24 stood 0.5 percentage points above the 4-year average of 78.2%.
The Index’s earnings beat rate outpaced the average in eight of the 17 quarters. More recently, the Index’s beat rate outpaced the average in just two of the past eight consecutive quarters. Keep in mind that the Q2’24 data in the chart reflects earnings results for 494 of the 503 companies that comprise the Index and is unlikely to change substantially in the coming weeks.
FactSet reported that the blended, year-over-year (y-o-y) earnings growth rate for the Index stood at 10.9% as of 8/16/24.
If the metric remains at that level, it will mark the highest y-o-y earnings growth rate for the Index since Q4’21 (+31.4%). Keep in mind, the Q4’21 results reflect favorable comparisons resulting from COVID lockdowns in 2020. For comparison, the five-year and ten-year average earnings growth rates for the Index were 9.4% and 8.4%, respectively.
Takeaway
While earnings beats are generally viewed as positive for the overall market, they represent just one piece of an intricate puzzle. As today’s chart reveals, the earnings beat rate for the companies that comprise the S&P 500 Index has been below the average in many of the time frames presented. Despite this fact, the S&P 500 Index closed at 5,528.93 on 9/3/24, representing an increase of 54.57% on a price only basis from its most recent low of 3,577.03 (10/12/22). Notably, the Information Technology Sector’s earnings beat rate declined from 87.7% in Q1’24 to 78.5% in Q2’24. A higher percentage of companies in the sector missed their estimates as well. The sector’s earnings misses increased to 15.4% in Q2’24 from 9.2% in Q1’24. These factors likely contributed to the sector’s recent lackluster performance. From 7/31/24 to 9/3/24, the S&P Information Technology Index fell by 3.23% on a total return basis. Only Energy fared worse, declining by 4.07% over the time frame. For comparison, Financials, Health Care, and Industrials (the three sectors with the largest percentage of earnings beats this quarter) increased by 3.78%, 4.88%, and 0.56%, respectively, over the period.


