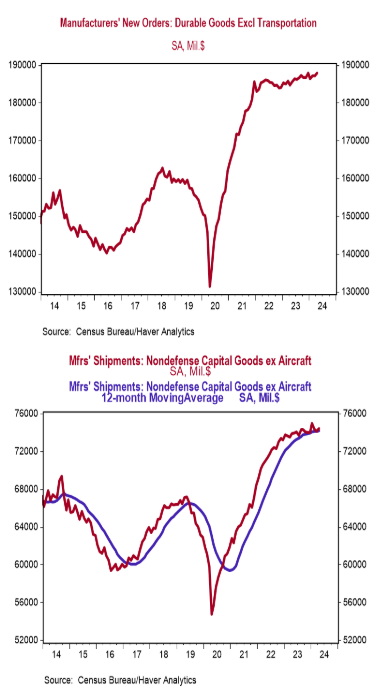
- New orders for durable goods rose 0.7% in April, versus a consensus expected decline of 0.8%. Orders excluding transportation rose 0.4%, versus a consensus expected +0.1%. Orders are down 0.9% from a year ago, while orders excluding transportation have risen 1.7%.
- Strong growth in orders for autos, primary metals, and computers were partially offset by a decline in orders for commercial aircraft.
- The government calculates business investment for GDP purposes by using shipments of non-defense capital goods excluding aircraft. That measure rose 0.4% in April. If unchanged in May and June, these orders would decline at a 0.4% annualized rate in Q2 versus the Q1 average.
Implications:
Stronger than expected growth in durable goods orders for April was tempered by downward revisions to prior months’ data, showing an economy that is progressing, but at a slowing pace. Let’s start with the headline number, showing durable goods orders rose 0.7%, beating consensus expectations for a 0.8% decline. At first glance this looks like sizeable outperformance, but earlier this month the Census Bureau (which publishes the durable goods report) revised data going all the way back to January 2012 to reflect new seasonal adjustment factors, resulting in downward revisions to recent prior months, and clouding comparability with forecasts. Rather than focusing on the month-to-month change, a look at progress over the past year is more instructive and shows durable goods order have declined 0.9% over the past twelve months. And that is before any adjustments for inflation. April orders were led higher by motor vehicles and parts, up 1.5% in April, though transportation orders are very volatile month-to-month. Stripping out the volatile transportation sector shows orders rose 0.4% in April and are up a modest 1.7% in the past year (and flat to down when factoring in inflation). Looking at the details of the report shows rising orders across all major non-transportation categories – led by primary metals (+1.3%), electrical equipment (+0.9%), computers and electronic products (+0.6%), machinery (+0.4%), and fabricated metal products (+0.3%). The most important number in the release, core shipments – a key input for business investment in the calculation of GDP – rose 0.4% in April. Here revisions to prior months are particularly notable, with January data being revised higher, and February and March now showing monthly declines of 0.8% and 0.3%, respectively. If the pace of these shipments remains unchanged in May and June, core shipment growth would decline at a 0.4% annualized rate in Q2 versus the Q1 average. The growth in shipments has moderated significantly since surging in 2020 as PPP loans and stimulus payments flooded the system, and shipments fell into contraction in the fourth quarter of 2023 before the rebound last quarter. We expect this trend of turbulent readings to continue as the economy feels the lagged effects of the Federal Reserve’s actions to tighten monetary policy. In other recent news, the Kansas City Fed Manufacturing Index, a measure of factory activity in that region, rose to a still negative -2 in May from -8 in April, further highlighting difficulties in the goods sector.


