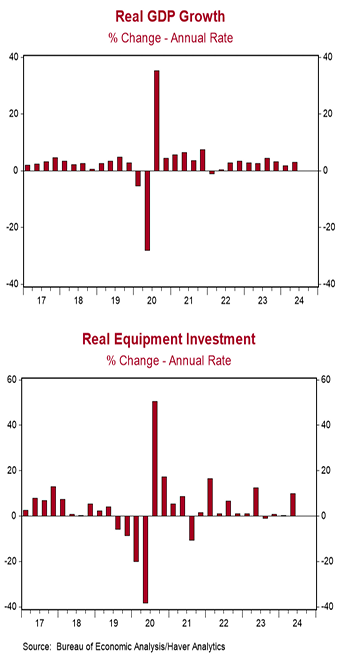
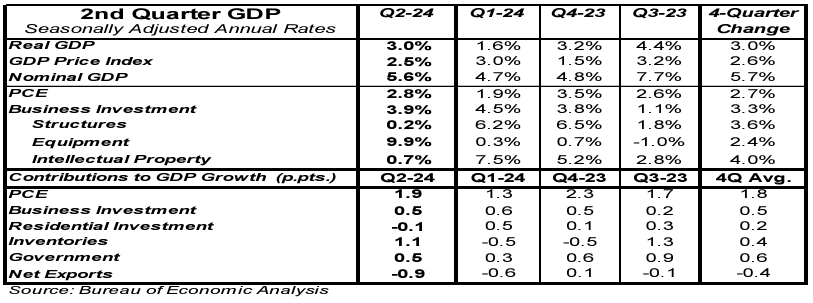
- Real GDP growth in Q2 was unrevised from a prior estimate of 3.0%, slightly above the consensus expected 2.9% annualized rate.
- Upward revisions to inventories and government purchases offset downward revisions to consumer spending, business investment, and net exports.
- The largest positive contributions to the real GDP growth rate in Q2 were consumer spending, inventories, and business investment. The weakest component was net exports.
- The GDP price index was unrevised coming in at a 2.5% annual growth rate. Nominal GDP growth – real GDP plus inflation – was revised higher to a 5.6% annualized rate from a prior estimate of 5.5%.
Implications: The final reading for real GDP growth in the second quarter remained unchanged from last month’s estimate, holding at a 3.0% annual rate. However, the underlying components showed a slightly weaker mix. Downward revisions in consumer spending (primarily non-durables), business investment (equipment & software), and net exports were balanced by upward revisions in inventories and government spending. For a more accurate measure of sustainable growth, we focus on "core" GDP, which includes consumer spending, business fixed investment, and home building, but excludes the more volatile categories like government purchases, inventories, and international trade. "Core" GDP grew at a 2.7% annual rate in Q2, below the prior estimate of 2.9%. The Bureau of Economic Analysis (BEA) also released its comprehensive annual update, revising data from the past five years. It now shows that average real GDP growth from Q2 2020 through 2023 was 5.5%, compared to the previously reported 5.1%. Additionally, the second look at economy-wide corporate profits for Q2 revealed a significant upward revision, with profits rising 3.6% from Q1 (compared to the 1.7% initially reported) and up 10.8% year-over-year. Since Federal Reserve profits are included in this data – and the Fed has been posting losses – we focus on corporate profits excluding the Fed, which are up 9.0% year-over-year. Using pre-tax profits, our Capitalized Profits Model suggests stocks remain overvalued. However, using after-tax profits suggests stocks are near fair value. We also received a second look at Q2 Real Gross Domestic Income (GDI), an alternative measure of economic activity, which was revised higher to a 3.4% annual growth rate and is now up 3.5% from a year ago. As for inflation, it remains stubborn. GDP inflation was unchanged at 2.5% annually in Q2, and GDP prices have risen 2.6% over the past year. Meanwhile, nominal GDP (real growth plus inflation) increased at a 5.6% annual rate in Q2 and is up 5.7% year-over-year.


