View from the Observation Deck
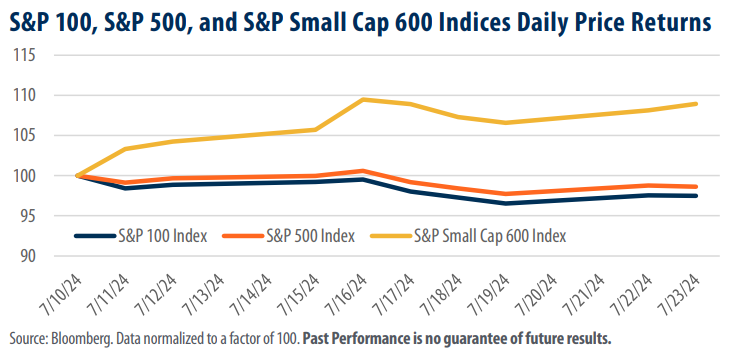
As represented in the chart above, a seismic shift in the performance of small cap stocks relative to their large cap counterparts appears to be underway. In light of this, we set out to review several of the factors we think set the stage for this environment. Our data set covers just nine business days commencing with the final day of Federal Reserve (“Fed”) chairman Jerome Powell’s most recent testimony to the Financial Services Committee on 7/10/24. For reference, the chart above includes the price-only returns of the largest 100 stocks in the S&P 500 Index (the S&P 100 Index), the S&P 500 Index, and the S&P Small Cap 600 Index normalized to a factor of 100.
• On 7/8/24, prior to Powell’s address, the federal funds rate futures market indicated there was a 72.0% chance that the Fed would cut its policy rate at its September meeting. That expectation surged following his remarks, rising to 98.0% on 7/23/24.
• Historically, the Fed’s policy rate has nearly matched the rate of inflation.
• Over the 30-year period ended 6/30/24, the federal funds target rate (upper bound) averaged 2.57% on a monthly basis. Inflation, as measured by the 12-month change in the consumer price index (CPI) averaged 2.5% over the same time frame.
• Comparatively, the federal funds target rate (upper bound) stood at 5.50% at the end of June, well above June’s CPI reading of 3.0%.
• Valuations for small cap stocks appear to be more attractive than their large cap counterparts. In fact, the price to earnings (P/E) ratio of the S&P Small Cap 600 Index currently sits at 16.29 compared to its 10-year average of 24.75 (as of 7/24). For comparison, the P/E ratios of the S&P 100 and S&P 500 Indices stood at 25.57 and 23.90, above their 10-year monthly averages of 20.83 and 21.13 as of the same date. Notably, year-overyear earnings for the S&P Small Cap 600 Index are estimated to decline by 5.48% in 2024 before becoming increasingly favorable the following year. In 2025, earnings are estimated to increase by 19.46% for the S&P Small Cap 600 Index, compared to 13.69% and 13.66%, respectively, for the S&P 100 and S&P 500 Indices.
• For reference, the price only returns for the indices in today’s chart were as follows (7/10/24 – 7/23/24): S&P 100 Index (-2.51%), S&P 500 Index (-1.39%), S&P Small Cap 600 Index (+8.92%).
Takeaway
Perhaps unsurprisingly, smaller companies are often more dependent on outside capital than their larger counterparts, who generally operate in a state of going concern. Given that equity valuations can vary based on the cost of raising capital (internally or externally), an easing in monetary policy would likely have an outsized impact on small cap valuations relative to other market capitalizations. Will the Fed cut rates in September? We don’t know, but the market appears increasingly certain of that outcome. Another noteworthy point is that the spread between the federal funds target rate (upper bound) and the CPI remains well-above historical norms. We expect small cap valuations could benefit from a narrowing of that spread, over time. In addition, small cap stocks remain a relative value compared to their peers. The trailing 12-month P/E ratio for the S&P 100 and S&P 500 Indices stood at 25.57 and 23.90, respectively, as of 7/24/24, above their 10-year monthly averages of 20.83 and 21.13. The S&P Small Cap 600 Index had a P/E of 16.29 as of the same date, well below its 10-year average of 24.75.


