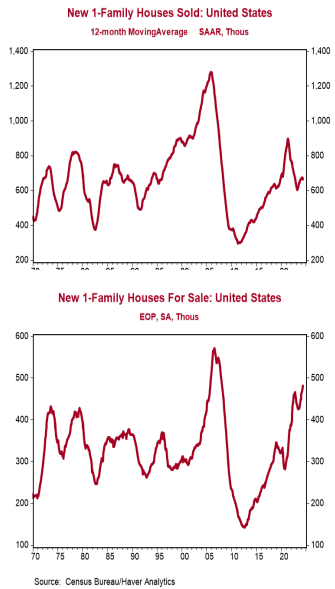
- New single-family home sales declined 11.3% in May to a 0.619 million annual rate, lagging the consensus expected 0.633 million. Sales are down 16.5% from a year ago.
- Sales in May fell in all the major regions.
- The months’ supply of new homes (how long it would take to sell all the homes in inventory) rose to 9.3 in May. The gain was due to both the slower pace of sales and a 7,000 unit increase in inventories.
- The median price of new homes sold was $417,400 in May, down 0.9% from a year ago. The average price of new homes sold was $520,000, up 4.9% versus last year.
Implications: New home sales came in weaker than expected in May, posting the largest monthly decline since 2022 following back-to-back gains. It looks like activity is stuck in low gear, with sales having normalized roughly at the same pace they were in 2019 before COVID. Stubbornly high inflation continues to be the biggest headwind to a broader recovery, delaying widely expected rate cuts from the Federal Reserve and keeping 30-year fixed mortgage rates above 7%. Assuming a 20% down payment, the rise in mortgage rates since the Federal Reserve began its current tightening cycle amounts to a 24% increase in monthly payments on a new 30-year mortgage for the median new home. The good news for potential buyers is that the median sales price of new homes has fallen 9.3% from the peak in 2022. It does look like a small part of this decline reflects a lower price per square foot as developers cut prices. The Census Bureau reports that from 2022 to 2023 (the most recent data available) the median price per square foot for single family homes sold fell 1.1%. While that decline is modest, it represents a stark reversal from the 45% gain from 2019 to 2022. That said, most of the drop in median prices is likely due to the mix of homes on the market including more lower priced options as developers complete smaller properties. Supply has also put more downward pressure on median prices for new homes than existing homes. The supply of completed single-family homes is up over 200% versus the bottom in 2022. Total inventories have continued to climb higher as well, hitting a new post-pandemic high in May. This contrasts with the market for existing homes which continues to struggle with an inventory problem, often due to the difficulty of convincing current homeowners to give up the low fixed-rate mortgages they locked-in during the pandemic. Though not a recipe for a significant rebound, more inventories giving potential buyers a wider array of options will continue to put a floor under new home sales. One problem with assessing housing activity is that the Federal Reserve held interest rates artificially low for more than a decade, and buyers started to believe those low rates were normal. With rates now reflecting true economic fundamentals, the sticker shock on mortgage rates for potential buyers is very real. However, we have had strong housing markets with rates at current levels in the past, and as long as the job market remains strong and buyers understand that the past was a mirage, it’s possible they will eventually adjust. In other recent housing news, the Case-Shiller index increased 0.3% in April and is up 6.3% from a year ago. Meanwhile, the FHFA index ticked up 0.2% in April and is up 6.4% from a year ago. In the manufacturing sector, the Richmond Fed index, a measure of factory activity in the mid-Atlantic, fell to -10 in June from 0 in May. Also earlier this week, the Federal Reserve released monthly figures on the money supply showing M2 up 0.4% in May and up 0.6% in the past year. After surging in the first two years of COVID, M2 declined from early 2022 through early 2023 and has since been close to flat. This recent history should eventually put downward pressure on the growth rate of nominal GDP.


