View from the Observation Deck
Total assets invested in covered call strategies have been growing rapidly over the past several years. Data from Morningstar Direct revealed that net assets in the “derivative income” group totaled $70.7 billion in May 2024, up from $44.5 billion over the same period the year before, according to Reuters.
Covered call strategies tend to be most beneficial when the stock market posts negative returns, or when returns range from 0%-10%.
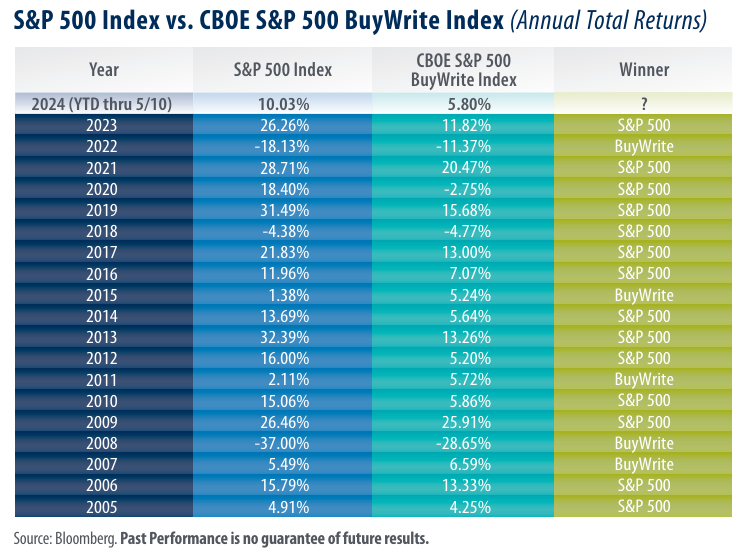
The S&P 500 Index posted negative total returns just three times in the table above. The CBOE BuyWrite Index outperformed the S&P 500 Index in two of those three years (missing the third year by 0.39 percentage points in 2018). For comparison, there are four years in the table where the S&P 500 Index posted returns between 0% and 10%. During those time periods, the CBOE BuyWrite Index outperformed the S&P 500 Index in three of the four years (missing the fourth year by 0.66 percentage points in 2005).
Covered call options can generate an attractive income stream and serve as a hedge against negative price movement, but they may limit the potential for capital appreciation.
There were 12 years in today’s table (not including 2024) where the S&P 500 Index notched total returns of 10% or more. The CBOE BuyWrite Index underperformed the S&P 500 Index in every one of them. Perhaps unsurprisingly, a similar story has played out so far in 2024. The S&P 500 Index’s total return stood at 10.03% on a year-to-date basis through 5/10. For comparison, the CBOE BuyWrite Index rose by 5.80% on a total return basis over the same period.
Takeaway
Covered call strategies may serve as a unique alternative to the S&P 500 Index. While the income they provide has generally led to outperformance during negative or moderately positive periods, returns can be capped during periods where the market is performing exceedingly well. As a recent example, the S&P 500 Index surged by 26.26% in 2023, outperforming the CBOE BuyWrite Index by 14.44 percentage points. Year-to-date through 5/10/24, the total return of S&P 500 Index has nearly doubled that of the CBOE BuyWrite Index. Forecasts suggest this lead may not hold. On April 15, 2024, a Bloomberg survey of 21 equity strategists revealed that their average 2024 year-end price target for the S&P 500 Index was 5,065. On 5/10/24, the S&P 500 Index closed at 5,222.68, 3.11% above those forecasts.


