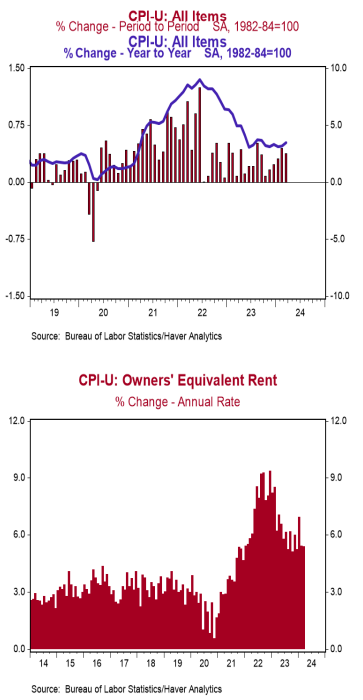
- The Consumer Price Index (CPI) rose 0.4% in March, above the consensus expected +0.3%. The CPI is up 3.5% from a year ago.
- Energy prices rose 1.1% in March, while food prices increased 0.1%. The “core” CPI, which excludes food and energy, rose 0.4% in March, above the consensus expected +0.3%. Core prices are up 3.8% versus a year ago.
- Real average hourly earnings – the cash earnings of all workers, adjusted for inflation – were unchanged in March but are up 0.6% in the past year. Real average weekly earnings are also up 0.6% in the past year.
Implications:
Where is the evidence that monetary policy is tight? Consumer prices rose 0.4% in March, pushing the twelve-month comparison up to 3.5%. At this point it looks clear that the progress against inflation made from mid-2022 to mid-2023 has stalled. Consumer prices were up 9.1% in the year ending in June 2022. While many thought the drop back to 3.0% in the year ending in June 2023 was all due to the Fed, it was likely influenced greatly by supply chain disruption and recovery. With CPI inflation back up to 3.5% from a year ago, it is clear that the problem has not gone away. Looking at the details, March inflation was boosted by energy prices, which rose 1.1% on the back of higher prices for gasoline. However, it’s important to point out that energy has not been the culprit for the stubbornly high inflation readings over the last year; energy prices are up 2.1% in the same timeframe versus 3.5% for overall prices. Stripping out energy and its often-volatile counterpart (food) to get “core” prices does not make the inflation picture look any better. That measure rose 0.4% in March for the third consecutive month, while the twelve-month comparison remained at 3.8%, proving that underlying pricing pressures remain stubbornly high. Rental inflation – both for actual tenants and the imputed rental value of owner-occupied homes – continue to defy predictions of imminent reversal, rising 0.4% for the month and running at or above a 5% annualized rate over three-, six-, and twelve-month timeframes. Housing rents have been a key driver of inflation over the last year, and we expect it to continue to do so, as it makes up a third of the weighting in the overall index and still hasn’t caught up with the rise in home prices in the past four years. But the most troublesome piece of today’s report for the Federal Reserve came from movement in a subset category of prices that the Fed itself has told investors to watch closely – known as the “Supercore” – which excludes food, energy, other goods, and housing rents, and is a useful gauge of inflation in the services sector. After large monthly increases in January and February, that measure jumped another 0.6% in March, driven by higher prices for motor vehicle insurance (+2.6%) and medical care services (+0.6%). In the last twelve months, this measure is up 4.8% and has been accelerating as of late; up at 8.2% and 6.1% annualized rates in the last three and six months, respectively. And while inflation remains stubbornly high, workers are no longer being compensated for it. Case in point, real average hourly earnings were unchanged in March. These earnings are up only 0.6% in the last year, a headwind for future growth in consumer spending. Putting this all together, the Fed has little reason at this point to start cutting rates. How they respond to the incoming economic data in the months ahead could determine whether we repeat the inflationary 1970s.


