View from the Observation Deck
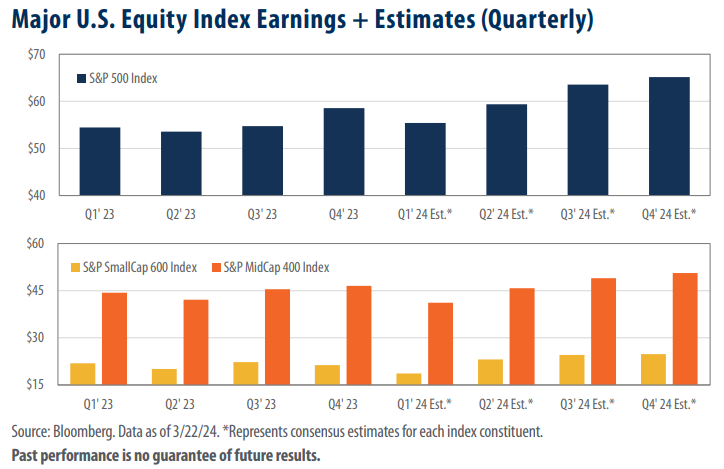
Today’s charts are intended to give investors a visual perspective on where equity analysts think earnings are headed. The charts cover the quarterly earnings per share (EPS) for 2023 and Bloomberg’s quarterly estimated EPS for 2024. For comparison, we included results and estimates from the S&P 500 Index (“LargeCap Index”), the S&P MidCap 400 Index (“MidCap Index”) and the S&P SmallCap 600 Index (“SmallCap Index”).
As revealed in today’s charts, the EPS of each index we tracked contracted slightly in Q2’23 before rebounding in Q3’23. Notably, the SmallCap Index was the only one of the three indices with a lower EPS in Q4’23 compared to Q1’23. Looking ahead, earnings estimates for each of the three indices reflect strength, in our opinion.
While it is true that EPS estimates for Q1’24 reflect a decline in year-over-year earnings for the MidCap and SmallCap Indices, the longer-term outlook is incredibly favorable. In Q4’24, the LargeCap, MidCap, and SmallCap Indices are all estimated to notch their highest quarterly earnings of the data series.
Yearly EPS estimates for each of the Indices for the 2024 and 2025 calendar years and their respective totals are as follows (not in the charts): S&P 500 Index ($243.37 and $273.46); S&P MidCap 400 Index ($185.43 and $212.68); S&P SmallCap 600 Index ($91.40 and $105.58).
Annual EPS for the LargeCap Index are estimated to increase to record-highs in 2024 and 2025 consecutively. The EPS for the MidCap and SmallCap Indices are expected to increase to their record highs in 2025.
Takeaway
In our February post on earnings and revenue growth (click here to view it), we voiced our opinion that the recent surge in the S&P 500 Index can be attributed, in part, to expected earnings growth for the companies that comprise the index. For today’s publication, we wanted to provide an alternative look at the data that informs this thought process, as well as an extended view into the mid and smallcap segments of the market. We believe that corporate earnings drive the direction of stock prices over time, especially when the major indices are trading at or near record highs. As the data shows, EPS are expected to trend higher across each of these indices over the next several quarters, with full year estimates reaching record-highs for each index in 2025. As always, these are estimates and could change. That said, we trust today’s post provides a unique perspective on what we view as a major catalyst of the recent surge in equity valuations.


