View from the Observation Deck
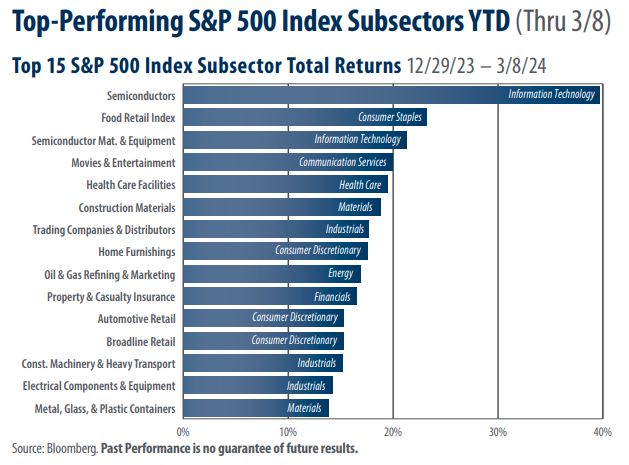
Today’s blog post is for those investors who want to drill down below the sector level to see what is performing well in the stock market. The S&P 500 Index was comprised of 11 sectors and 126 subsectors as of 3/8/24, according to S&P Dow Jones Indices. The 15 top-performing subsectors in the chart posted total returns ranging from 39.63% (Semiconductors) to 13.83% (Metal, Glass, & Plastic Containers. Click here to view our last post on the top performing subsectors.
• As indicated in the chart above, the Consumer Discretionary and Industrial sectors each had three subsectors represented in the top 15 performers on a year-to-date basis. Information Technology and Materials each had two subsectors represented in the top 15 over the same time frame.
• With respect to the 11 major sectors that comprise the S&P 500 Index, Information Technology posted the highest total return for the period captured in the chart, increasing by 11.27%, according to data from Bloomberg. The second and third-best performers were Communication Services and Financials, with total returns of 10.86% and 8.00%, respectively. The S&P 500 Index posted a total return of 7.73% over the period.
• As of 3/8/24, the most heavily weighted sector in the S&P 500 Index was Information Technology at 29.84%, according to S&P Dow Jones Indices. For comparison, the Communication Services and Financials sectors had weightings of 8.83% and 12.99%, respectively.
• Using 2024 consensus earnings estimates, the Information Technology and Energy sectors had the highest and lowest price-to-earnings (P/E) ratios at 29.12 and 12.30, respectively, as of 3/11/24. For comparison, the S&P 500 Index had a P/E ratio of 21.28 when calculated using its 2024 consensus earnings estimates as of the same date.
Takeaway
The Information Technology, Communication Services, and Financial sectors accounted for 43.37%, 13.72%, and 13.26%, respectively, of the total return of the S&P 500 Index YTD through 2/29/24, according to data from S&P Dow Jones Indices. With a total return of 11.27%, technology stocks are the top-performer in the S&P 500 Index YTD through 3/8/24, followed closely by communication services companies (10.86%). Notably, four of the 15 subsectors in today’s chart come from the S&P 500 Industrials sector, unchanged from our last post on this topic. We maintain that the sector may be reaping the benefits of renewed governmental funding via the CHIPS Act. For those investors who may have an interest, there are a growing number of packaged products, such as exchange-traded funds, that feature S&P 500 Index subsectors.


