View from the Observation Deck
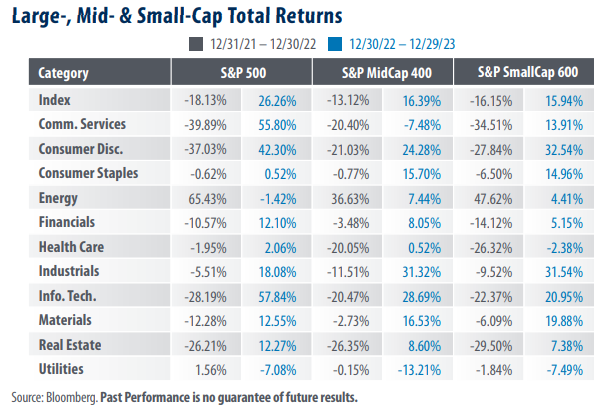
We update today’s table on a regular basis to provide insight into the variability of sector performance by market
capitalization. As of the close on 12/29/23, the S&P 500 Index stood just 0.56% below its all-time closing high,
according to data from Bloomberg. The S&P MidCap 400 and S&P SmallCap 600 Indices stood 4.44% and 10.08% below their respective all-time highs.
• Large-cap stocks, as represented by the S&P 500 Index (“LargeCap Index”), posted total returns of 26.26% in 2023, significantly outperforming the S&P MidCap 400 (“MidCap Index”) and S&P SmallCap 600 (“SmallCap Index”) indices, with total returns of 16.39% and 15.94%, respectively, over the period (see table). That said, the tide shifted in November and December of 2023, with mid-cap and small-cap stocks outperforming their large-cap counterparts. The total return of the LargeCap, MidCap, and SmallCap Indices stood at 14.08%, 17.96%, and 22.08%, respectively, over the two-month period.
• Sector performance can vary widely by market cap and have a significant impact on overall index returns. Three of the more extreme cases in 2022 were Health Care, Energy, and Consumer Discretionary. In 2023, the Communication Services and Technology sectors reveal a significant variance of returns across market capitalizations.
• Technology and communication services stocks, the two top-performing sectors in 2023, represented 28.9% and 8.6%, respectively, of the weight of the LargeCap Index at the close of 2023. By comparison, those sectors represented 9.7% and 1.7% of the MidCap Index, and 12.0% and 2.7% of the SmallCap Index, respectively.
• As of the close on 12/29/23, the trailing 12-month price-to-earnings (P/E) ratios of the three indices in today’s table were as follows: S&P 500 Index P/E: 22.94; S&P MidCap 400 Index P/E: 17.86; S&P SmallCap 600 Index P/E: 16.34.
Takeaway
As today’s table reveals, market performance can vary widely across market capitalizations and sectors. In 2023, Information Technology and Communication Services were the top-performing sectors in the S&P 500 Index, accounting for over 70% of the index’s total return during the year. The S&P MidCap 400 and S&P SmallCap 600 Indices also had sectors that outperformed their peers, but none to the level of those in the S&P 500 Index. That said, the table fails to capture a notable change that occurred over the last two months of the year. In November and December alone, the MidCap and SmallCap Indices rose by a staggering 17.96% and 22.08%, respectively, on a total return basis. For comparison, the two-month total return in the LargeCap Index was 14.08%. In addition, the total return of the S&P 500 Equal Weight Index was 16.61% over the same period (not in table). While two months does not make a trend, this data could be a signal that investors are finding value outside of the narrow market of the past year. Over the 10-year period ended 12/29/23, the average monthly P/E ratios for the three indices in today’s table were as follows: S&P 500 Index: 20.67; S&P MidCap 400 Index: 21.25, and S&P SmallCap 600 Index: 25.22, according to data from Bloomberg. As of market close on 12/29/23 the P/E ratios for those indices stood at 22.94, 17.86, and 16.34, respectively.


