View from the Observation Deck
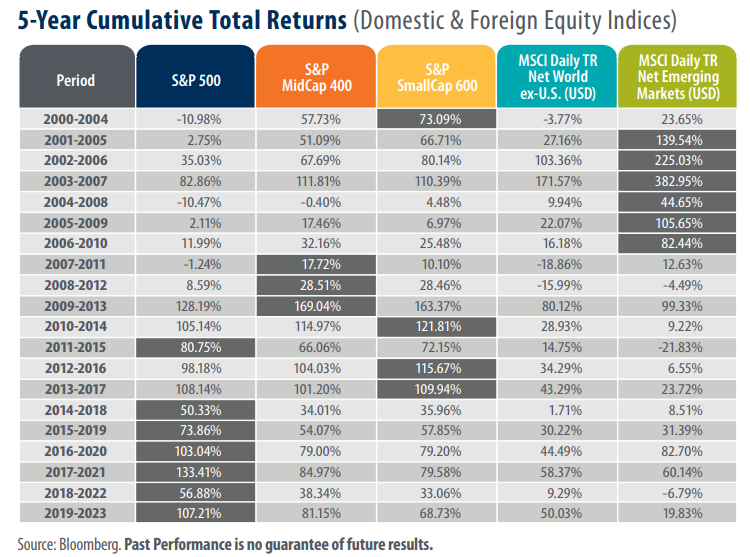
Today’s blog post features the cumulative total returns of five major equity indices (three domestic and two foreign) since the start of 2000. We chose to highlight 5-year rolling total returns in an effort smooth out intra-year volatility introduced by the significant number of challenging global events that transpired since 2000. We update this post on an annual basis. Click here to see our 2023 update to this topic.
Emerging markets equities clearly outperformed in the first decade covered in the table but have lagged the U.S. indices since. In the U.S., large-, mid-, and small-capitalization (cap) stocks have shared the spotlight dating back to 2007, with large-caps (S&P 500 Index) dominating all six of the last 5-year rolling periods. The dramatic shift in performance can be explained, in part, by trends in the price of the U.S. dollar. A weak U.S. dollar can boost returns for U.S. investors holding positions in unhedged foreign securities, and vice versa. From 2000-2009, the U.S. Dollar Index declined by 23.57% − a nice tailwind for foreign holdings. From 2010-2019, the index appreciated by 23.80% − a notable headwind for foreign holdings. During the current decade, spanning 2020-2023, the index rose 5.13% to a reading of 101.33, well above its 20-year average reading of 88.91.
The S&P 500 Index endured four bear markets (a price decline of 20% or more from a recent peak) since the start of this millennium. The four bear markets spanned the following dates: 3/24/00-10/9/02, 10/9/07-3/9/09, 2/19/20-3/23/20, and 1/3/22-10/12/22. During those time periods, the S&P 500 Index posted total returns of -47.38%, -55.22%, -33.79%, -24.50 and respectively, according to Bloomberg. Notably, despite suffering two bear markets over the past five years, the S&P 500 Index retained its spot as the top-performer in our table, posting a 5-year rolling total return of 107.21% for the period ended December 2023.
For additional context, the average annual total returns for the five equity indices from 12/31/99-12/29/23, were as follows (not shown in table): 7.03% (S&P 500); 9.48% (S&P MidCap 400); 9.54% (S&P SmallCap 600); 3.74% (MSCI Daily TR Net World ex-U.S. in USD); and 5.59% (MSCI Daily TR Net Emerging Markets in USD), according to Bloomberg.
Takeaway
The returns depicted in today’s table offer a powerful reminder that the buy and hold strategy can still serve investors well. Despite rising geopolitical tensions, wars, government lockdowns, and two bear markets (in the S&P 500 Index), each of the indices in today’s table reflect positive total returns over the most recent 5-year rolling period. While the S&P 500 Index has recently been a clear outlier, there is no way to predict what indices could outperform next. For those investors with extended time horizons, today’s table may serve as an antidote to an overly myopic outlook regarding their equity holdings.


