View from the Observation Deck
On 8/4/20, the yield on the 10-year Treasury note (T-note) closed at an all-time low of 0.51%, according to Bloomberg. Since then, the yield on the 10-year T-note rose by 433 basis points (bps) to 4.84% on 10/27/23. To view the last post we did on this topic, click here.
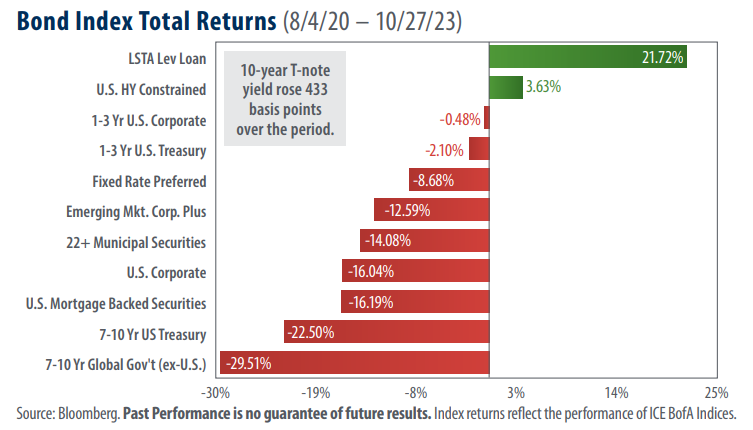
Per the chart above, the 433 bps increase in the 10-year T-note coincided with a dramatic sell-off in longer duration fixed income categories.
As many investors may be aware, bond yields typically move in the opposite direction of bond prices. Notably, only two of the 11 debt categories represented in today’s chart are in positive territory. They are leveraged loans (senior loans), which are floating-rate speculative-grade securities, and U.S. high-yield bonds, commonly known as “junk” bonds because of their lower credit quality. Both categories are also known for their shorter duration profiles, a feature which may have helped them to weather the recent interest rate climate more effectively, in our opinion.
Including the initial rate hike of the current cycle, which occurred on 3/16/22, the Federal Reserve (“Fed”) has enacted 11 increases to the federal funds target rate (upper bound), bringing the rate from 0.25% where it stood in at the start of March 2022 to 5.50% at the end of July 2023.
One byproduct of these rate hikes has been a sharp decline in the rate of inflation. A common measure of inflation is the trailing 12-month change in the Consumer Price Index (CPI). The CPI stood at 3.7% in September 2023, significantly below its most recent high of 9.1% in June 2022. That said, more recent data could be seen as an indication that rising prices are not entirely under control. September’s CPI reflected a 0.7 percentage point increase in prices over the metric’s most recent low of 3.0% set in June 2023.
Emerging market bonds and intermediate-term global government bonds were deep into negative territory for the period captured in the chart.
The strength in the U.S. dollar likely had a negative impact on the performance of foreign bonds, in our opinion. The U.S. Dollar Index (DXY) rose by 14.11% over the period indicated in today’s chart, according to Bloomberg. The U.S. Dollar Index stood at 106.56 as of the close of trading on 10/27/23. The index has closed above the 100 mark in all but four trading sessions since 4/13/22, according to data from Bloomberg.
Takeaway
Today’s chart reveals the impact tighter monetary policy can have on fixed income securities. This begs the question: what is the Fed’s next move? On one hand, inflation remains well-above the Fed’s target of 2.0%, and data appears to show that the U.S. consumer and labor market are relatively strong. Additionally, U.S. real GDP grew at a rate of 4.9% in the third quarter and is now up 2.9% on an annual basis. In our view, these factors could be a signal to the Fed that further monetary tightening may be necessary. On the other hand, the Fed has indicated that they expect that rates may need to be held higher for longer and data from the futures markets indicates that rate cuts could begin as soon as May of 2024. We expect this to be a constantly evolving situation, and will report back as developments occur.


