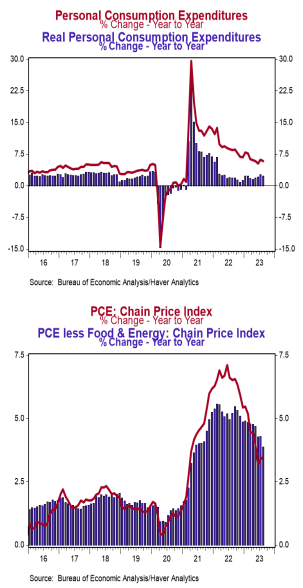
- Personal income rose 0.4% in August matching consensus expectations. Personal consumption rose 0.4% in August, narrowly lagging a consensus expected +0.5%. Personal income is up 4.8% in the past year, while spending has increased 5.8%.
- Disposable personal income (income after taxes) rose 0.2% in August and is up 7.3% from a year ago.
- The overall PCE deflator (consumer prices) rose 0.4% in August and is up 3.5% versus a year ago. The “core” PCE deflator, which excludes food and energy, rose 0.1% in August and is up 3.9% in the past year.
- After adjusting for inflation, “real” consumption rose 0.1% in August and is up 2.3% from a year ago.
Implications:
Continued growth in income, spending, and prices should continue to keep the Fed on its toes. The best news in today’s report was that incomes rose 0.4% in August and are up 4.8% in the last year, led by gains in private-sector wages & salaries (+0.5% for the month and up 5.6% year-to-year). Growth in consumer spending matched the growth in income in August, rising 0.4%, with healthy spending across both goods and services. Goods spending rose 0.6% on the month and is up 2.9% in the past year, while “real” inflation-adjusted spending on goods is up 2.1%. Spending on services rose 0.4% in August and is up 7.4% in the past year (2.4% when adjusted for inflation). The transition in dollars spent back toward services has remained an ongoing theme. Given the surge in goods activity (and the inflation in goods prices) during COVID, we expect goods spending will struggle to keep pace as the economy continues to shift back toward a more “normal” mix of activity. On the inflation front, PCE prices – the Federal Reserve’s preferred measure of inflation – rose 0.4% in August, pushing the twelve-month comparison up to 3.5%, a second move higher for year-ago comparisons in as many months. Look for another upward move for September given the continued rise in oil prices. “Core” inflation, which excludes food and energy, is up 3.9% versus a year ago. Note that the Fed also watches a subset of inflation dubbed the “Super Core,” which is services only (no goods), excluding food, energy, and housing. That measure rose 0.1% in August and is up 4.4% versus a year ago (down less than a percentage point from the 5.2% peak in October 2022). Inflation continues to take a toll on the economy, which is also feeling more of the effects of the decline in the money supply over the past year. On the housing front, pending home sales, which are contracts on existing homes, fell 7.1% in August after a 0.5% increase in July. Plugging these figures into our model suggests existing home sales will be down in September. In manufacturing news, the Kansas City Fed index, a measure of factory activity in that area, fell to -8 in September from a reading of 0 in August, while the Chicago PMI – a measure of business activity – fell to 44.1 in September from 48.7 in August. We expect next week’s national manufacturing report to come in at 47.7, still signaling contraction.


