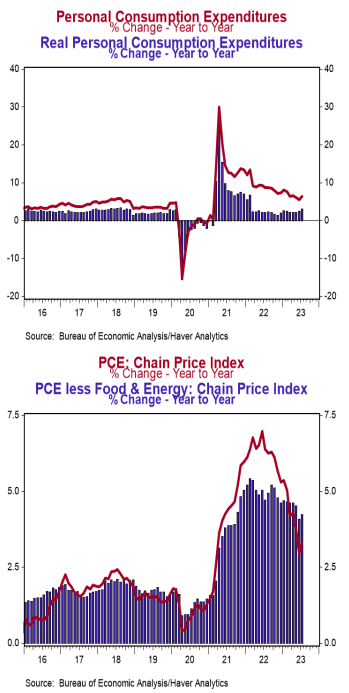
- Personal income rose 0.2% in July (+0.1% including revisions to prior months), lagging the consensus expected +0.3%. Personal consumption rose 0.8% in July, beating the consensus expected +0.7%. Personal income is up 4.6% in the past year, while spending has increased 6.4%.
- Disposable personal income (income after taxes) was unchanged in July (+0.1% including revisions to prior months) and is up 7.2% from a year ago.
- The overall PCE deflator (consumer prices) rose 0.2% in July and is up 3.3% versus a year ago. The “core” PCE deflator, which excludes food and energy, also rose 0.2% in July and is up 4.2% in the past year.
- After adjusting for inflation, “real” consumption rose 0.6% in July and is up 3.0% from a year ago.
Implications:
Income and spending started the back half of 2023 on a healthy note, but consumer strength will also keep the Fed on guard. The best news in today’s report was that incomes rose 0.2% in July and are up 4.6% in the last year, led by gains in private-sector wages & salaries (+0.4% for the month and up 4.8% year-to-year). Growth in consumer spending outpaced incomes in July, with a pickup in spending across all major categories. Goods spending rose a healthy 0.7% on the month and is up 2.8% in the past year, while “real” inflation-adjusted spending on goods is up 3.3% in the last twelve months as goods prices have declined from year-ago levels. Spending on services rose 0.8% in July and is up 8.3% in the past year (2.9% when adjusted for inflation). The transition in dollars spent back toward services has remained an ongoing theme. Given the surge in goods activity (and inflation in goods prices) during COVID, we expect goods spending will struggle to keep pace as the economy continues to shift back toward a more “normal” mix of activity. On the inflation front, PCE prices – the Federal Reserve’s preferred measure of inflation – rose 0.2% in July, pushing the twelve-month comparison up to 3.3%. Look for another upward move for August given the recent spike in oil prices. “Core” inflation, which excludes food and energy, is up 4.2% versus a year ago. Note that the Fed is now closely watching a subset of inflation dubbed the “Super Core,” which is services only (no goods), excluding food, energy, and housing. That measure rose 0.5% in July and is up 4.7% versus a year ago (down a mere 0.2% from the 4.9% peak in November 2021). Inflation continues to take a toll on the economy, which is also feeling more of the effects of the decline in the money supply over the past year. The Fed’s fight is not over, and there is plenty of room to stumble before crossing the finish line. In employment news this morning, initial claims for jobless benefits fell 4,000 last week to 228,000, while continuing claims rose 28,000 to 1.725 million. These figures suggest continued job growth in August. On the housing front, pending home sales, which are contracts on existing homes, rose 0.9% in July after a 0.4% increase in June. Plugging these figures into our model suggests existing home sales will move modestly higher in August. Finally, the Chicago PMI – a measure of business activity in the regions – rose to 48.7 in August from 42.8 in July. We expect tomorrow’s national manufacturing report to come in at 47.1, signaling contraction but less so than last month.


