View from the Observation Deck
We update this post every few months so that investors can see which of the two styles (growth or value) are delivering the better results. Click here to see our last post on this topic.
• Value stocks have tended to outperform growth stocks when the yield on the benchmark U.S. 10-year Treasury note (T-note) rises, and growth stocks tend to outperform value when the yield on the 10-year T-note falls. The yield on the 10-year T-note rose by 351 bps over the 3-year period ended 8/11/23, according to data from Bloomberg. For comparison, the yield on the 10-year T-note has risen by 28 bps YTD through 8/11/23, with 19 bps of that increase occurring since the end of July.
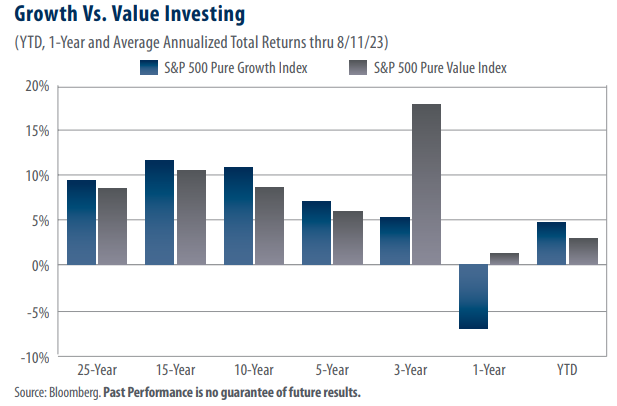
• The total returns in today’s chart are as follows (Pure Growth vs. Pure Value):
25-year avg. annual (9.35 % vs 8.44%)
15-year avg. annual (11.59% vs. 10.53%)
10-year avg. annual (10.84% vs. 8.65%)
5-year avg. annual (7.08% vs. 5.89%)
3-year avg. annual (5.25% vs. 17.80%)
1-year (-7.12% vs. 1.24%)
YTD (4.68% vs. 2.86%)
• As of 7/31/23, the sector with the largest weighting in the Pure Growth Index was Energy at 28.2%, according to S&P Dow Jones Indices. At 22.3%, Financials had the largest weighting in the S&P 500 Pure Value Index (Pure Value Index) on the same date.
• With a YTD return of 3.06% through 8/11/23, Financials were the seventh-best performing (out of 11) major sector in the S&P 500 Index. By comparison, Energy posted a YTD total return of 4.19%.
• The top three performing sectors and their YTD total returns (through 8/11/23) are as follows: Communication Services (42.08%); Information Technology (36.39%); and Consumer Discretionary (33.86%). As of 7/31/23 those three sectors comprised 21.4% and 36.3% of the total weighting of the Pure Growth and Pure Value Indices, respectively.
Takeaway
As the total returns in today’s chart illustrate, the Pure Growth Index has enjoyed higher total returns than the Pure Value Index in five of the seven time periods presented, including the YTD time frame. In our view, expectations regarding near-term changes in the yield of the 10-year T-note may be influencing investors’ appetite for growthoriented names. Debate regarding the direction of the federal funds target rate continues, with the federal funds rate futures market pricing in an 11% chance of a rate hike at the next Federal Open Market Committee meeting on 9/20/23. The same futures market indicates that interest rate cuts are expected as soon as December 2023. The reality is that regardless of the Federal Reserve’s next move, there’s no way to predict the direction of the yield on the 10-year T-note. From our perspective, given the various averages presented in today’s chart, investors may be best served by diversifying their capital allocations across both market styles.


