View from the Observation Deck
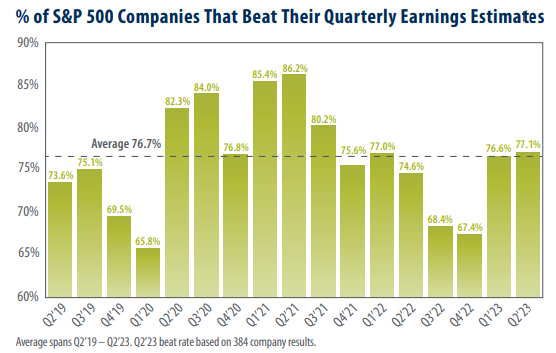
We update this post on an ongoing basis to provide investors with insight into the earnings beat rate for the companies that comprise the S&P 500 Index (“Index”). As many investors may know, equity analysts often adjust their corporate earnings estimates higher or lower on an ongoing basis. While these estimates may provide insight into the expected financial performance of a given company, they are not guarantees. From Q2’19 through Q2’23 (the 17 quarters in today’s chart), the average earnings beat rate for the companies that comprise the index was 76.7%.
• As indicated in the chart, the percentage of companies in the index that reported higher than expected earnings increased over the past two quarters.
After falling to its lowest level since Q1’20 (the start of the COVID-19 pandemic), the earnings beat rate for the index rose to 76.60% and 77.08% in Q1’23 and Q2’23, respectively. Keep in mind that the Q2’23 results in the chart reflect earnings results for 384 of the 503 companies that comprise the index and could change over the coming weeks.
• The S&P 500 Index posted an average annual total return of 12.74% for the period covered by the chart (06/28/19–06/30/23), according to Bloomberg.
• Consumer Staples (91.67%), Health Care (91.11%) and Information Technology (90.91%) have registered the highest earnings beat rates in Q2’23 (not in chart), according to S&P Dow Jones Indices. Real Estate had the lowest beat rate at 50.00%.
Takeaway
While earnings beats are generally viewed as positive news for the overall market, they may not tell the whole story. FactSet reported that as of 8/4/23 the overall blended earnings (combines actual results with estimates for companies yet to report) for the companies in the S&P 500 Index declined by 5.2% on a year-over-year (y-o-y) basis in Q2’23. If that figure holds, it will represent the biggest y-o-y earnings decline for the index since Q3’20 when earnings fell by 5.7%. It will also represent the index’s third straight quarterly y-o-y earnings decline. Additionally, of the 269 companies that have issued full-year earnings per share (EPS) guidance for the current fiscal year, 107 of them (40%) are forecasting negative EPS growth.


