View from the Observation Deck
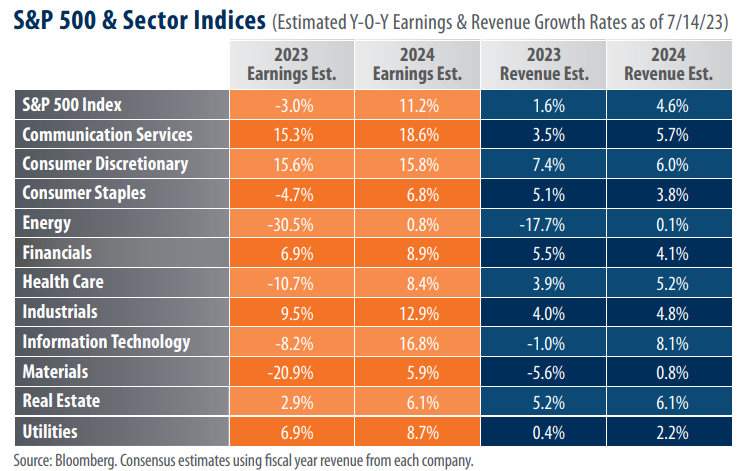
As we head into second quarter earnings season, we thought it would be timely to provide an update regarding estimated 2023 and 2024 earnings and revenue growth rates for the companies comprising the S&P 500 Index. On July 14, 2023, the S&P 500 Index closed the trading session at 4,505.42, 6.07% below its all-time closing high of 4,796.56 on January 3, 2022, according to Bloomberg. From 1928-2022 (95 years) the S&P 500 Index posted an average annual total return of 9.40%. Looking ahead, for the market to trend higher we believe earnings will need to increase, with higher revenues arguably the best catalyst for earnings growth.
Earnings estimates were revised lower since our last post on this topic at the end of February.
When we wrote about this topic on February 28, 2023 (Click here to view that post), prevailing estimates were for earnings to decline by 1.8% in 2023. Earnings estimates have fallen steadily throughout the year, however, and the earnings growth rate for the S&P 500 Index is now expected to be -3.0% in 2023. Not good. That said, 2024 offers the potential for good news. As indicated by 2024’s estimated earnings growth rate of 11.2%, earnings could see a healthy rebound next year. Five of the eleven sectors that comprise the S&P 500 Index reflect positive year-over-year (y-o-y) earnings growth rate estimates of 10.0% or more for 2024, compared to two in 2023.
Revenue growth rate estimates reveal a similar pattern.
Perhaps unsurprisingly, the decline in earnings estimates for the 2023 calendar year was paired with falling revenue growth rate expectations. In our previous post on this topic, the forecasted revenue growth rate for companies in the S&P 500 Index stood at 1.9%. Since then, revenue growth rate estimates declined slightly and now stand at 1.6%. Notably, even though 2023 revenue growth estimates fell, projections for 2024 reveal the opposite trend. As of July 14, 2023, they stood at 4.6%, representing an increase from 4.5% as of the last time we posted, reflecting easier comparisons. Five of the eleven sectors that comprise the S&P 500 Index reflect positive y-o-y revenue growth rate estimates of 5.0% or more for 2024, compared to four in 2023.
Takeaway
Keep in mind that the 2023 earnings and revenue growth rates in today’s table reflect comparisons to record results in the 2022 calendar year. The Energy, Industrials, and Materials sectors, for example, experienced y-o-y earnings growth rates of 264.7%, 44.0%, and 21.5%, respectively, in 2022. Given the mixed economic environment and the potential for tighter monetary policy in the months ahead, we are not surprised to see earnings growth rates come down or even trend negative in 2023 (see table). That said, comparisons for 2024 earnings and revenue growth look significantly improved over this year’s estimates. Time will ultimately reveal the accuracy of these forecasts, but we maintain that the higher revenues forecast in the coming year could be the best catalyst for growing earnings. We will continue to update on this topic as new data becomes available.


