View from the Observation Deck
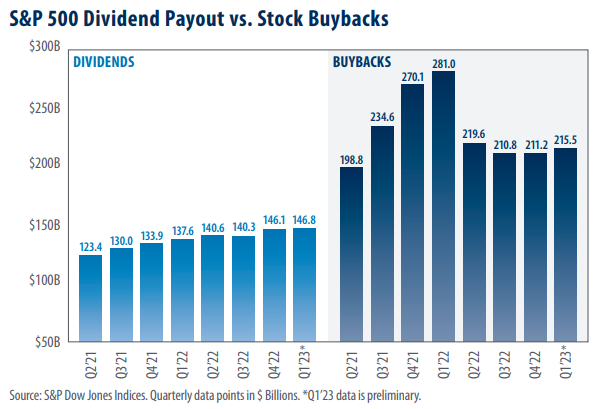
Companies have a number of ways in which to return capital to their shareholders. As the chart above shows, cash dividends and stock buybacks have been two of the more popular methods that corporations have utilized in recent years. Dividend distributions steadily increased over the period, while share buybacks receded after peaking in Q1’22. Even so, buybacks remain a significant source of overall capital disbursements. Total shareholders return of dividends and buybacks stood at $1.431 trillion during over the trailing 12-month period ended March 2023.
• The all-time high for the S&P 500 Index’s quarterly dividend payout was the $146.8 billion distributed in Q1’23, up from the previous record of $146.1 billion in Q4’22, according to data from S&P Dow Jones Indices.
• As the chart shows, dividend distributions increased on a quarterly basis for six of the quarters represented in today’s chart. In total, the companies that comprise the S&P 500 Index distributed $573.7 billion in dividends for the trailing 12-month period ended March 2023, up from $524.9 billion for the same time frame ended March 2022.
• Quarterly stock buybacks totaled $215.5 billion in Q1’23, down from a record high of $281.0 in Q1’22, but up from $211.2 billion in Q4’22, according to data from S&P Dow Jones Indices. • Despite the downward trend revealed in the chart, annual share repurchases stood at a record $922.7 billion for the 2022 calendar year.
• Year-to-date through Q1’23, the S&P 500 Index sectors that were most aggressive in repurchasing their stock were as follows (% of all stocks repurchased): Financials (21.8%); Information Technology (21.3%); and Health Care (10.8%), according to S&P Dow Jones Indices.
Takeaway
Despite quarter-over-quarter increases in both dividend distributions and share repurchases, the companies that comprise the S&P 500 Index increased their cash holdings. Corporate cash holdings, as measured by the S&P 500 Industrials (Old) Cash & Equivalents (excluding Financials, Utilities and Transportation companies), totaled $1.65 trillion (preliminary) on 3/31/23, up from $1.58 trillion on 12/30/22. As indicated in today’s chart, stock buybacks remain below the high set in Q1’22. That said, buybacks increased in each of the last two quarters, indicating that the 1% tax on buybacks that went into effect this year has not slowed demand for share repurchases, in our opinion. Dividend distributions remained relatively consistent over the time frame above. In our view, this is to be expected. Generally, companies tend to avoid cutting their dividend, as the action can be seen as an indication of financial weakness.


