View from the Observation Deck
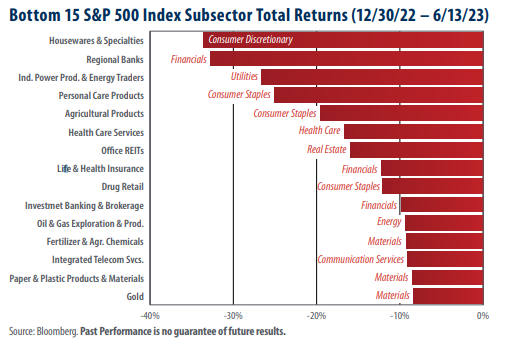
Today’s blog post is for those investors who want to drill down below the sector level to see what is not performing well in the stock market. The S&P 500 Index was comprised of 11 sectors and 126 subsectors as of 6/9/23, according to S&P Dow Jones Indices. The 15 worst-performing subsectors in today’s chart posted total returns ranging from -8.34% (Gold) to -33.53% (Housewares & Specialties) over the period. Click here to view our last post on the worst performing subsectors.
• As indicated in the chart above, the S&P 500 Index Consumer Staples, Financials, and Materials sectors each had three subsectors among the worst performers. Housewares and Specialties, a subsector of the Consumer Discretionary sector was the worst performer, posting a total return of -33.53% for the period.
• With respect to the 11 sectors that comprise the S&P 500 Index, Energy posted the worst total return for the period, falling by 6.53%, according to Bloomberg. The second-and third-worst performers were Utilities and Health Care, with total returns of -5.33% and -2.79%, respectively. The S&P 500 Index posted a total return of 14.66% for the period.
• Notably, while the Consumer Discretionary sector has the worst subsector represented in today’s chart (Housewares & Specialties), the broader sector posted the third-highest total return (29.27% through 6/13/23) of the 11 sectors that make up the S&P 500 Index.
• The most heavily weighted sector in the S&P 500 Index was Information Technology at 27.59% as of 6/9/23, according to S&P Dow Jones Indices. For comparison Utilities, Materials, and Real Estate had the lowest weightings at 2.66%, 2.46%, and 2.42%, respectively.
• Of the 11 sectors that comprise the S&P 500 Index, Energy had the lowest estimated year-end price-to-earnings (P/E) ratio (9.88 as of 5/31/23), followed by Financials and Materials with P/E ratios of 12.41 and 16.21, respectively.
Takeaway
The Consumer Staples, Financials, and Materials sectors account for nine of the fifteen worst-performing subsectors in today’s chart. Year-to-date through 6/13/23, Energy, Utilities, and Health Care have seen the worst total returns of the 11 sectors, having declined by 6.53%, 5.33%, and 2.79%, respectively over the period. As always, there are no guarantees, but there could be some potential deep value opportunities in this group of subsectors. For those investors who have interest, there is a growing number of packaged products, such as exchange-traded funds, that feature S&P 500 Index subsectors.


