View from the Observation Deck
Today’s blog post compares the performance of energy-related stocks to the broader market, as measured by the S&P 500 Index, over an extended period. We target energy and utility stocks for a few reasons. First, most developed and developing economies are dependent on oil/gasoline, natural gas, and electricity for their growth, and prices of those commodities can influence valuations of the companies involved in those sectors. Second, as evidenced by the $7,500 federal tax credit for Plug-in Electric and Fuel Cell Electric Vehicles, there is a strong push to get consumers to opt for electric and electric hybrid alternatives (EVs) over traditional internal combustion engine vehicles moving forward. As demand for EVs grows, it is possible that Utilities (electrical grid) could see increased demand when compared to Energy (oil and gasoline).
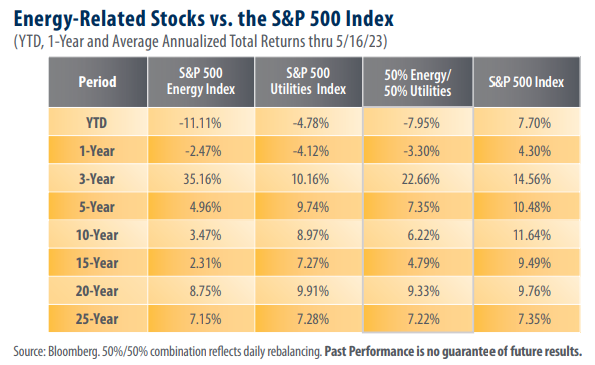
As indicated in the table, the Energy and Utilities Indices posted negative total returns over the 1-year and YTD periods, respectively. As expected, the 50/50 blend of the two sectors also posted negative total returns over the same time frames. The S&P 500 Index fared comparatively well, posting positive total returns across each of the time frames in today’s table.
The recent sell-off in energy-related stocks is reflected in the comparatively poor returns displayed in today’s table. Broadly speaking, the Energy Index outperformed the S&P 500 Index in just one of the eight time frames referenced above. Likewise, the Utilities Index and the 50/50 blend outperformed the S&P 500 Index in just one time frame each. Notably, Utilities outperformed Energy in six of the eight time frames above. By contrast, when we last updated this post on 9/15/22 (Click here to view that blog entry), Utilities had outperformed the S&P 500 Index in four of the eight periods, Energy had outperformed the S&P 500 Index in three of the periods, and the 50/50 blend enjoyed outperformance in five of the eight time frames.
The Price to Earnings (P/E) multiples for all three indices in today’s table sit below their 20-year averages.
As of 5/22/23, the 2023 year-end P/E ratios for the S&P 500, Energy, and Utilities Indices stood at 19.07, 10.38, and 17.51, respectively. By contrast, the 20-year average P/E ratios for those same indices stood at 18.31, 34.14, and 16.58, respectively, through 5/22/23. Energy and Utilities stocks had a combined weighting of approximately 7.05% in the S&P 500 Index, according to data from Bloomberg. The P/E ratios for the S&P 500 Index, Energy Index, and the Utilities Index reflect year-over-year earnings growth estimates for 2023 of -2.49%, -27.4%, and 7.7%, respectively, as of 5/19/23.
Takeaway
With total returns of 65.43% and 1.56%, respectively, Energy and Utilities were the only S&P 500 Index sectors to post positive total returns in 2022 (not in table). Since then, they have underperformed the broader S&P 500 Index by a significant margin. Notably, the 2023 expected year-over-year earnings growth rate for the Energy Index stood at -27.4%, while earnings for the Utilities Index are expected to grow 7.7%. We are not surprised to see the earnings growth for Utilities companies remain positive, even with the threat of a recession. Most households will keep using their lights, air conditioning, stoves, and furnaces even if budgets are stretched. Energy stocks, on the other hand, tend to be more volatile. The potential for lower economic activity means fewer deliveries, trips to the store, and travel, which can have a negative effect on the earnings of Energy companies.


