View from the Observation Deck
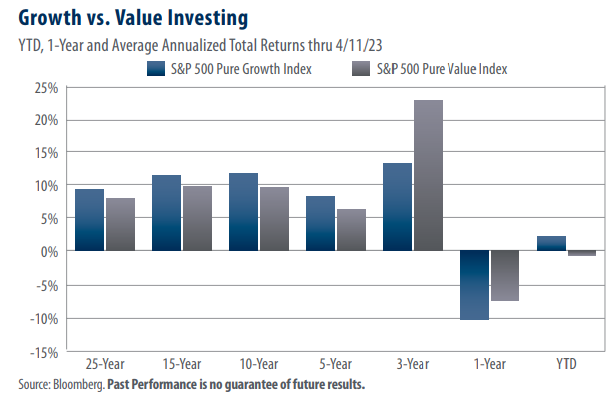
We update this post every few months so that investors can see which of the two styles (growth or value) are delivering better results. This time around, we included a 25-year data point in the chart along with the usual time frames we have written about in prior posts.
• The most recent results show that growth and value stocks have traded the lead on a 1-year and year-to-date (YTD) basis. Having said that, the S&P 500 Pure Growth Index (Pure Growth Index) outperformed its value counterpart in five of the seven periods featured in the chart above.
• Value stocks have tended to outperform growth stocks when the yield on the benchmark 10-year Treasury note (T-note) rises, and vice versa. The yield on the 10-year T-note rose by 271 bps over the 3-year period ended 4/11/23, according to data from Bloomberg. For comparison, the yield on the 10-year T-note fell 45 basis points to 3.43% year-to-date through 4/11/23.
• The total returns in today’s chart are as follows (Pure Growth vs. Pure Value):
25-year avg. annual (9.20% vs 7.89%)
15-year avg. annual (11.40% vs. 9.73%)
10-year avg. annual (11.65% vs. 9.55%)
5-year avg. annual (8.13% vs. 6.21%)
3-year avg. annual (13.15% vs. 22.68%)
1-year (-10.50% vs. -7.58%)
YTD (2.08% vs. -0.76%)
• As of 3/31/23, the sector with the largest weighting in the Pure Growth Index was Energy at 27.5%, according to S&P Dow Jones Indices. At 21.3%, Financials had the largest weighting in the S&P 500 Pure Value Index (Pure Value Index) on the same date.
• With a YTD return of -5.03% through 4/11/23, Financials have suffered the worst return of the 11 major sectors that comprise the S&P 500 Index. By comparison, Energy posted a YTD total return of -0.30%.
• The top three performing sectors and their YTD total returns are as follows: Communication Services (22.20%); Information Technology (19.04%); and Consumer Discretionary (13.12%). Those three sectors comprise 20% and 38.6% of the total weighting of the Pure Growth and Pure Value Indices, respectively.
• The last post we did on this topic was on November 1, 2022. Click here to view it.
Takeaway
As the total returns in today’s chart illustrate, the Pure Growth Index has enjoyed higher total returns than the Pure Value Index in five of the seven time periods presented, including the YTD time frame. In our view, the more recent performance difference can be explained, in part, by sector weightings. Financials, which made up 21.3% of the Pure Value Index as of 3/31/23, are the worst-performing of the 11 major sectors that comprise the broader S&P 500 Index. By comparison, the Pure Growth Index held just 5.5% of financial companies as of the same date. Additionally, growth stocks have tended to outperform value stocks during periods of falling yields. The yield on the benchmark 10-year T-note shed 45 basis points YTD through 4/11/23, which may have provided ballast to growth-oriented names.


