View from the Observation Deck
On 8/4/20, the yield on the 10-year Treasury note (T-note) closed at an all-time low of 0.51%, according to Bloomberg. Since then, the yield on the 10-year T-note rose by 319 basis points (bps), settling at 3.70% as of 3/10/23. To view the last post we did on this topic, click here.
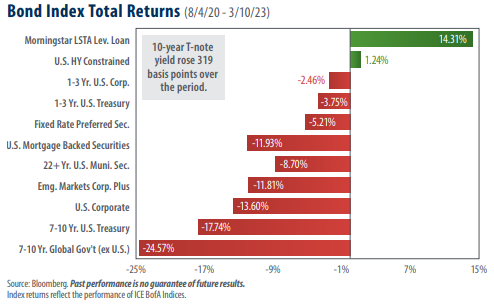
Per the chart above, the 319 bps increase in the 10-year T-note coincided with a dramatic sell-off in longer-duration fixed-income categories.
As many investors may be aware, bond yields typically move in the opposite direction of bond prices. Notably, only two of the 11 debt categories represented in today’s chart are in positive territory. They are leveraged loans (senior loans), which are floating-rate speculative-grade securities, and U.S. high-yield bonds, commonly known as “junk” bonds because of their lower credit quality. Both categories are also known for their shorter duration profiles, a feature which may have helped them to weather the recent interest rate climate more effectively, in our opinion.
Inflation, as measured by the trailing 12-month rate of change in the Consumer Price Index (CPI), is at a level not seen since 1990, according to data from the Bureau of Labor Statistics (excluding October 2021, when it was trending towards its June 2022 peak of 9.1%).
We want to acknowledge that inflation, as measured by the CPI, has been trending downward since peaking at 9.1% in June 2022. That said, February’s CPI rate of 6.0% represents the highest level we have seen since 1990. In response to surging inflation, the Federal Reserve (“Fed”) has raised the federal funds target rate (upper bound) at a rapid pace. As of 02/28/23, the federal funds target rate (upper bound) stood at 4.75%, up from 0.25% on 2/28/22. We will be watching to see if the Fed continues to push interest rates higher over the next few meetings.
Emerging market bonds and intermediate-term global government bonds were deep into negative territory for the period captured in the chart.
The strength in the U.S. dollar definitely had a negative impact on the performance of foreign bonds, in our opinion. The U.S. Dollar Index (DXY) rose by 11.99% over the period indicated in today’s chart, according to Bloomberg. The U.S. Dollar Index stood at 104.58 as of the close of trading on 3/10/23. The index has closed above the 100 mark in every trading session since 4/13/22, according to data from Bloomberg.
Takeaway
Today’s chart reveals the impact tighter monetary policy can have on fixed income securities. This begs the question: what is the Fed’s next move? On one hand, inflation remains stubbornly high, and the U.S. consumer and labor market appear to be relatively strong. These factors could be a signal to the Fed that further monetary tightening is necessary. On the other hand, the U.S. just experienced its second-largest bank failure of all-time. Brian Wesbury, Chief Economist at First Trust Portfolios LP noted that last week’s news about Silicon Valley Bank makes a 50 basis point hike unlikely. The situation is changing rapidly, and the yield on the 10-year T-note has been volatile, shedding an additional 12 basis points on 3/13/23 to settle at 3.58% as of market close. We will keep monitoring the data and report back on this topic as warranted.


