View from the Observation
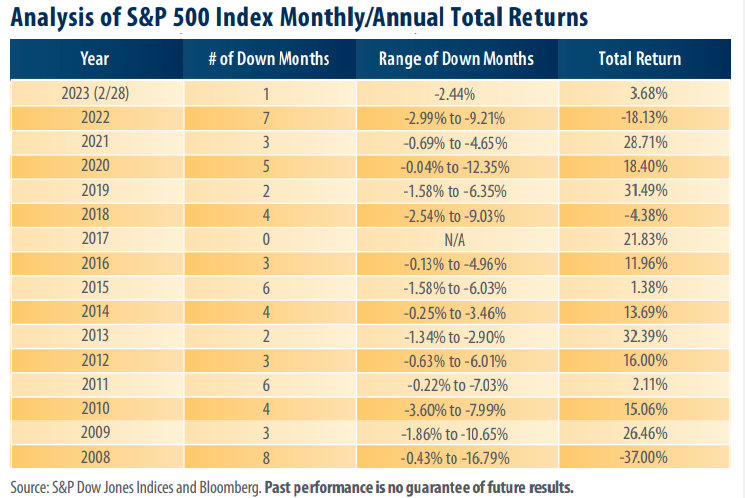
Deck In 2017, the S&P 500 Index (“index”) did not register a single down month on a total return basis, which includes reinvested dividends. That is not typically the case. In 14 of the past 15 calendar years (2008-2022), which includes the 2008-2009 financial crisis, the index endured no less than two negative total return months and as many as eight (see table).
From 2008 through February 2023, the S&P 500 Index endured a loss in 61 of the 182 months on a total return basis, or approximately 33.5% of the time. Over that same period, the index posted an average annualized total return of 8.95%, according to Bloomberg.
For comparative purposes, from 1926 through 2022, the S&P 500 Index posted a loss in 26 of the 97 calendar years on a total return basis, or approximately 26.8% of the time, according to data from Ibbotson Associates/Morningstar. Over that same period, the index posted an average annual total return of 10.12%.
• In 2020, there were five down months and the -12.35% total return posted in March of that year marked the largest monthly decline for any year in the table, following 2008. Despite the five down months, the index posted a total return of 18.40%.
• Year-to-date through 2/28/23, the S&P 500 Index has endured one down month (February), according to S&P Dow Jones Indices.
• A Bloomberg survey of 24 equity strategists found that their average 2023 year-end price target for the S&P 500 Index was 4,050 as of 2/17/23, which represents no change from 4,050 on 1/20/23 (24 strategists surveyed), according to its own release. The highest and lowest estimates were 4,750 (unchanged) and 3,225 (unchanged), respectively. The index closed trading on 3/14/23 at 3,919.29.
• Brian Wesbury, Chief Economist at First Trust Advisors L.P., announced on December 12, 2022, that he is looking for a 2023 year-end price target of 3,900.
Takeaway
After posting a total return of 6.28% in January (the index’s best start to the year since 2009), the S&P 500 Index reversed course, falling by 2.45% on a total return basis in February. Losses continued into March. Monthto-date through 3/14/23, the index is down 1.19% on a total return basis. The year has been volatile, but as you can see from the table, volatility is the norm. Furthermore, given recent news surrounding the banking sector, stubbornly high inflation, and the possibility of the U.S. experiencing an economic recession later this year, it is our view that the potential for volatility could remain elevated in 2023. That said, stock prices don’t rise in a straight line and investors are going to encounter some turbulent times along the way. Remember, the S&P 500 Index has never failed to fully recoup any losses sustained from corrections or bear markets over time.


