View from the Observation Deck
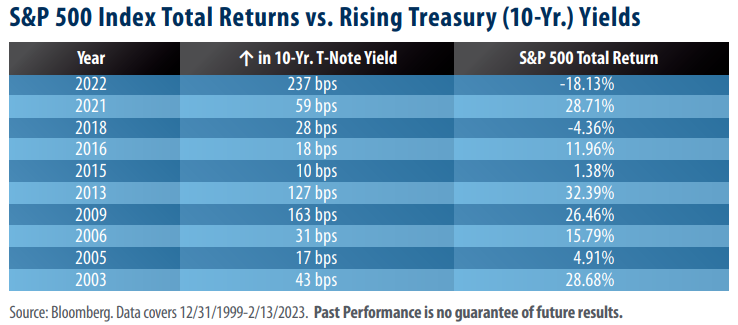
Today’s blog post provides some historical perspective on how the S&P 500 Index has performed in calendar years when the yield on the benchmark 10-year Treasury note (T-note) finished the year higher than where it began. From 2000-2022 there were ten such years (see table).
The S&P 500 Index posted a positive total return in eight of those ten years. 2022 represents the only 12-month period in today’s table where the yield on the 10-year T-note rose by more than 200 basis points and the S&P 500 Index experienced double-digit losses.
The Federal Reserve (“Fed”) increased interest rates at an unprecedented pace in 2022. In a previous blog post (Click here for “Uncharted Waters”) we wrote that the 425 basis point (bps) increase in the federal funds target rate (upper bound) in 2022 represented a 17-fold surge over where the rate stood at the start of the year (25 bps). We also pointed out that the Fed’s target rate had never been so low at the start of such a steep tightening cycle. Adding to the mounting pressure of rising rates, the Price to Earnings (P/E) ratio of the S&P 500 Index (“index”) was 25.75 at the start of the year, well above its 20-year average of 19.04 (thru 12/31/22). As the federal funds rate rose, the combination of a rapidly growing discount rate and stretched valuations led to a downturn in equity prices, as indicated by the negative total return for the index over the year. Monitoring the yield on the 10-year T-note is commonplace for equity investors. The higher the yield trends, the more competitive Treasuries and other investment-grade bonds tend to become as a potential alternative investment opportunity to equities. As the data in the table reveals, there were several years where the S&P 500 Index achieved above-average total returns (2003 and 2021, for example), but the yield on the 10-year T-note didn’t increase substantially by comparison. Alternatively, in 2009 and 2013, the yield on the 10-year T-note surged by more than 100 bps, and equity returns were astonishingly high. Why was 2022 different? The short answer, in our view, is risk. Amidst the backdrop of a potential recession, stretched valuations within the S&P 500 Index and surging yields on the 10-year T-note, investors took the opportunity to move assets elsewhere, in our opinion.
Takeaway
When reviewing the data in today’s table, it becomes clear that one of these years is not like the others. In previous periods where the yield on the 10-year T-note rose by more than 100 bps, the S&P 500 Index enjoyed remarkable total returns. That was not the case in 2022. As they grappled with stretched equity valuations, stubbornly high inflation and a rapidly increasing federal funds rate, investors appear to have taken shelter in risk-off assets. The risk-on trade made a resurgence to start the 2023 calendar year with the S&P 500 Index posting a year-to-date total return of 8.24% (thru 2/15). Notably, as of 2/15/23 the P/E ratio of the index stood at 19.70, and the yield on the 10-year T-note closed at 3.81%. With a Consumer Price Index reading of 6.4% and estimates calling for negative earnings growth for the year, we may not be out of the woods just yet.


