View from the Observation Deck
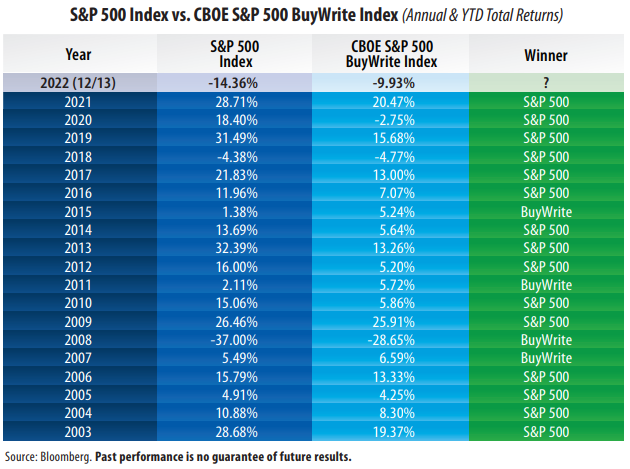
1. From 2003-2021, the CBOE S&P 500 BuyWrite Index (an index designed to measure a covered call strategy) outperformed the S&P 500 Index in just four of the 19 calendar years. We chose 2003 because it was the first year of a new bull market.
2. For comparative purposes, from 1926-2021 (96 years), the S&P 500 Index posted an average annual total return of 10.46%, according to Morningstar/Ibbotson Associates.
3. While covered call options can generate an attractive level of current income, they can also cap the potential for capital appreciation.
4. The use of a covered call portfolio tends to be most beneficial to investors when the stock market posts down years (2008) and when returns range from 0% to 10% (2007, 2011 and 2015), though the BuyWrite Index did not outperform the S&P 500 Index in 2005 or in 2018.
5. Covered call writing tends to be less beneficial when stock market returns are above 10%, such as in 2010, 2012, 2013, 2014, 2016, 2017, 2019 and 2020 (see table). The strategy, however, performed well in 2021.
6. A Bloomberg survey of 17 equity strategists found that their average 2023 year-end price target for the S&P 500 Index was 4,009 as of 12/1/22, according to its own release. The highest and lowest estimates were 4,500 and 3,400, respectively.
7. The S&P 500 Index closed at 4,019.65 on 12/13/22, just above its 2023 year-end price target of 4,009 (essentially a flat market forecast for 2023). As of 12/13/22, the index stood 16.20% below its all-time high of 4,796.56 set on 1/3/22.
8. As of 12/09/22, Bloomberg's consensus estimated year-over-year earnings growth rates for the S&P 500 Index for 2022, 2023 and 2024 were 8.31%, 2.61% and 9.76%, respectively. The 2.61% earnings growth projection for 2023 has been revised downward. It stood at 9.97% at the start of 2022.
9. The CBOE S&P 500BuyWrite Index has outperformed the S&P 500 Index so far in 2022 (see table). It has not outperformed the S&P 500 Index for a calendar year since 2015. Stay tuned!


