View from the Observation Deck
1. Last week’s blog post on 11/22/22 (click here) discussed the potential for a flat stock market in 2023, as measured by the S&P 500 Index. That being said, the blog also talks about potential opportunities for income-oriented investments, including stocks and bonds.
2. With respect to equities, one niche worth investigating is higher-yielding dividend paying stocks, according to Morgan Stanley.
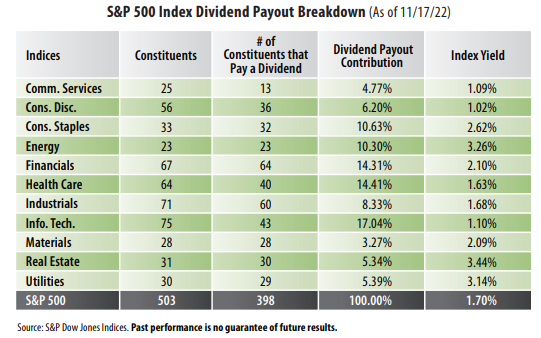
3. Per the table above, there were six sectors with yields above the 1.70% yield generated by the S&P 500 Index as of 11/17/22. They were as follows: 3.44% (Real Estate); 3.26% (Energy); 3.14% (Utilities); 2.62% (Consumer Staples); 2.10% (Financials); and 2.09% (Materials).
4. As indicated in the table, Information Technology, Health Care and Financials contributed the most to the S&P 500 Index's dividend payout at 17.04%, 14.41% and 14.31%, respectively. Information Technology and Health Care, however, were not among the highest-yielding sectors.
5. As of 11/17/22, the S&P 500 Index sector weightings were as follows (not in table): 26.52% (Information Technology); 15.04% (Health Care); 11.60% (Financials); 10.38% (Consumer Discretionary); 8.47% (Industrials); 7.44% (Communication Services); 6.92% (Consumer Staples); 5.38% (Energy); 2.93% (Utilities); 2.66% (Materials); and 2.65% (Real Estate), according to Bloomberg.
6. Data from Bloomberg indicates that as of 11/28/22, the dividend payments from the constituents in the S&P 500 Index totaled $60.54 per share (record high) in 2021, up from $58.95 (previous record high) in 2020. The estimates for 2022 and 2023 were $65.96 and $70.43, respectively.
7. A dividend payout ratio of 60% or less is typically a good sign that a dividend distribution is sustainable, according to The Motley Fool. A dividend payout ratio reflects the amount of money paid out as a dividend relative to a dollar's worth of earnings. In Q3'22, the payout ratio on the S&P 500 Index was 38.47%, according to Bloomberg


