View from the Observation Deck
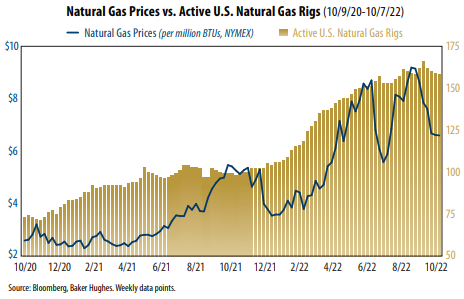
1. As of the close on 10/7/22, the price of natural gas stood at $6.75 per million British thermal units (BTUs), up 146.35% from $2.74 per million BTUs at the close on 10/9/20.
2. The average price (daily data) of natural gas for the period captured in the chart above was $4.75 per million BTUs. The highest closing price for the period was $9.68 per million BTUs on 8/22/22.
3. As indicated in the chart, the number of active natural gas rigs in the U.S. has spiked from 73 on 10/9/20 to 158 on 10/7/22, or an increase of 116.44%. Natural gas producers have opportunistically done so to exploit the higher price, in our opinion.
4. The price of natural gas is also up because demand for U.S. liquified natural gas (LNG) is rising. The U.S. Energy Information Administration (EIA) data indicates that U.S. natural gas exports hit an all-time high of 637.56 million cubic feet in March 2022. That figure stood at 395.42 million cubic feet in September 2020, the month prior to the start date in the chart.
5. The EIA reported that natural gas production set a record high in 2021, up 3.5% year-over-year. It sees production continuing to rise through 2023.
6. The winter season is closing in and that could impact the price of natural gas as well. The EIA estimates that U.S. households that use natural gas to heat their homes will spend an average of $931 to do so this winter, up 28% year-over-year.
7. The Farmers’ Almanac released its winter weather forecast and it called for frigid temperatures to permeate multiple areas of the U.S., particularly the North Central region, according to USA TODAY. That region includes Iowa, Colorado, Kansas, Minnesota, Missouri, Montana, Nebraska, North Dakota, South Dakota and Wyoming.


