View from the Observation Deck
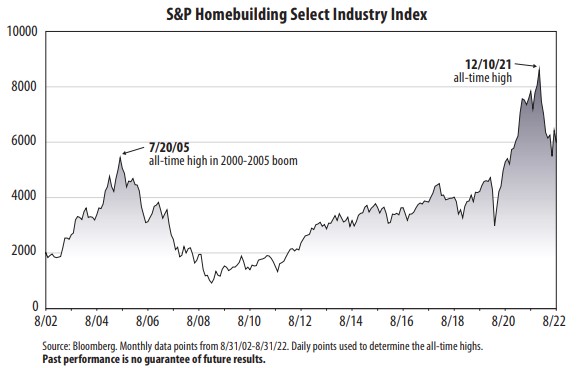
1. Since reaching its all-time high on 12/10/21, the S&P Homebuilding Select Industry Index has given back all of the price gains it made since the first week of 2021.
2. The good news is, as of 8/31/22, the S&P Homebuilding Select Industry Index was still 8.10% above the 2005 peak achieved in the prior housing boom.
3. Year-to-date through 8/31/22, the S&P Homebuilding Select Industry Index posted a total return of -29.81%, compared to -16.14% for the S&P 500 Index, according to Bloomberg.
4. The return on this homebuilder-related index, however, has thumped the broader market so far in this millennium. From 12/31/99 through 8/31/22, the S&P Homebuilding Select Industry Index posted a cumulative total return of 603.34% (8.98% annualized), compared to 314.29% (6.47% annualized) for the S&P 500
Index, according to Bloomberg.
5. The performance of homebuilder-related stocks has mirrored the recent plunge in the sentiment for new construction. The National Association of Home Builders Market Index (SA) registered a reading of 49 in August 2022, according to Bloomberg. The all-time high was 90, set in November 2020. A reading above 50 indicates more builders view conditions as good than poor. Its average reading since its inception in January 1985 is 52. The low for the period was 8, set in January 2009.
6. Housing starts in the U.S. totaled an annualized 1.446 million in July 2022, lagging the consensus estimate of 1.527 million starts, according to the U.S. Census Bureau. Starts were down 8.1% year-over-year.
7. New building permits reached an annual rate of 1.674 million in July 2022, topping the consensus estimate of 1.640 million, according to the U.S. Census Bureau. Permits were down 11.7% year-over-year for single-family units, but up 23.5% for multi-unit homes.
8. The 2022 and 2023 consensus earnings-per-share estimates (in dollars) for the S&P Homebuilding Select Industry Index were $752.33 and $686.86, respectively, as of 9/7/22, according to Bloomberg. Actual earnings totaled $591.29 per share in 2021.
9. Bloomberg's 2022 and 2023 estimated year-end price-to-earnings (P/E) ratios on the S&P Homebuilding Select Industry Index were 7.83 and 8.58, respectively, as of 9/7/22. That is well below the index's 14.56 P/E at the close of 2021 and its 5-year average P/E of 14.33.


