View from the Observation Deck
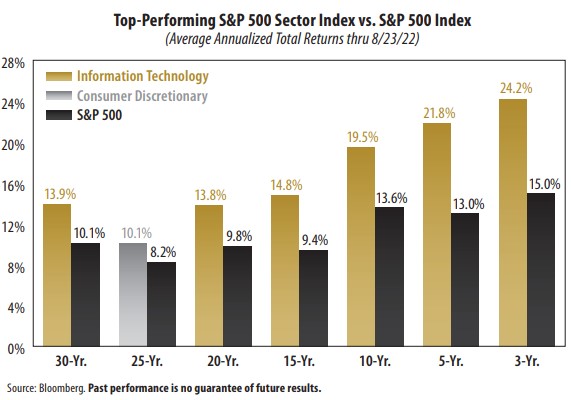
1. The S&P 500 Index is comprised of 11 major sectors. When it comes to performance, we believe that one of them stands above the rest: Information Technology.
2. Information Technology was the top-performing sector in six of the seven periods featured in the chart. By the way, it came in second to Consumer Discretionary for the 25-year period ended 8/23/22.
3. We excluded the 1-year and year-to-date periods so as not to distort the chart. The energy was the clear winner. On a total return basis, Energy was up an eye-popping 81.4% for the 1-year period ended 8/23/22 and is up 51.5% so far in 2022.
4. On a cumulative total return basis, the average annualized total returns in the chart look as follows (Sector vs. S&P 500): 30-year (4,812.9% vs. 1,690.1%); 25-year (999.1% vs. 610.3%); 20-year (1,231.7% vs. 551.6%); 15-year (688.8% vs. 282.9%); 10-year (492.0% vs. 257.6%); 5-year (168.5% vs. 84.5%); and 3-year avg. annual (91.7% vs. 52.3%).
5. From 1992-2021, Information Technology was the top performer in 10 of those calendar years (1993, 1994, 1996, 1998, 1999, 2003, 2009, 2017, 2019 & 2020), according to Bloomberg.
6. Information Technology carries the biggest sector weighting in the S&P 500 Index. It stood at 27.7% as of 8/24/22, according to Bloomberg. Health Care was a distant second at 14.0%.


