View from the Observation Deck
1. The yield on the 10-year Treasury note (T-note) closed at an all-time low of 0.51% on 8/4/20, according to Bloomberg.
2. From 8/4/20 through 8/9/22, its yield rose from 0.51% to 2.78%, or an increase of 227 basis points, based on the close of trading. It reached as high as 3.48% on 6/14/22 during the period.
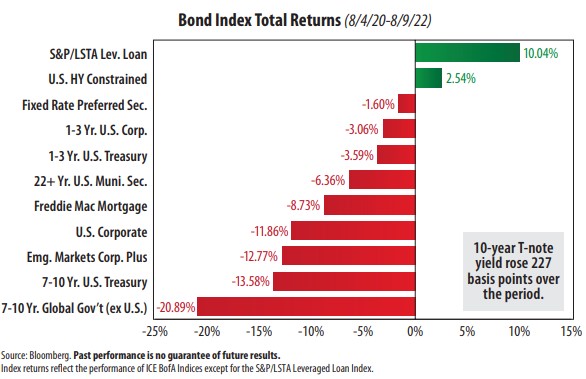
3. As indicated in the chart above, the only two debt categories in positive territory for the period were leveraged loans (senior loans) and high yield corporate bonds, both of which are speculative-grade securities.
4. Emerging market bonds and intermediate-term global government bonds were deep into negative territory for the period captured in the chart. The strength in the U.S. dollar definitely had a negative impact on the performance of foreign bonds, in our opinion. The U.S. Dollar Index (DXY) rose by 13.91% over the same period, according to Bloomberg.
5. Inflation remains elevated. The trailing 12-month CPI (Consumer Price Index) stood at 8.5% in July 2022, up from 1.3% from August 2020. The CPI is at a level not seen since 1982, according to data from the Bureau of Labor Statistics.
6. As of 8/9/22, the federal funds target rate (upper bound) stood at 2.50%, up from 0.25% this past March. The Fed has signaled that it is prepared to take rates higher if the data warrants it. The Fed’s next meeting is scheduled for September 20-21.
7. For comparative purposes, the federal funds target rate (upper bound) averaged 2.46% for the 30-year period ended 8/9/22. Stay Tuned!


