View from the Observation Deck
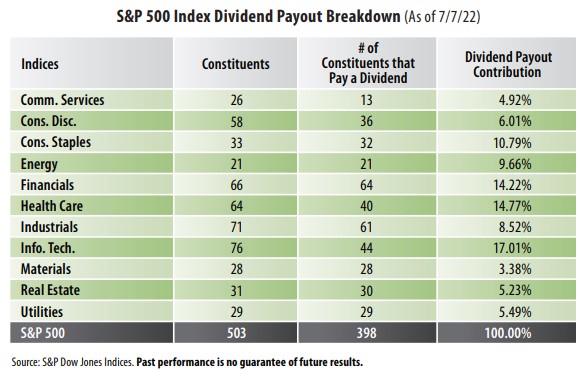
1. As of 7/7/22, 398 of the constituents in the S&P 500 Index distributed a cash dividend to shareholders. There are currently 503 stocks in the index.
2. For comparative purposes, since 1980, the highest number of dividend-paying stocks in the S&P 500 Index at year-end was 469 (1980), while the lowest
number was 351 (2001 & 2002), according to S&P Dow Jones Indices.
3. As indicated in the chart, Information Technology, Health Care and Financials contributed the most to the S&P 500 Index's dividend payout at 17.01%, 14.77%
and 14.22%, respectively, as of 7/7/22 (see table).
4. The S&P 500 Index sector weightings are as follows (7/8/22): 27.25% (Information Technology); 15.00% (Health Care); 10.91% (Consumer Discretionary); 10.73% (Financials); 9.10% (Communication Services); 7.63% (Industrials); 6.85% (Consumer Staples); 4.19% (Energy); 3.00% (Utilities); 2.86% (Real Estate); and 2.50% (Materials), according to Bloomberg.
5. As of 7/8/22, data from Bloomberg indicates that the dividend payments from the constituents in the S&P 500 Index totaled $60.54 per share (record high) in
2021, up from $58.95 (previous record high) in 2020. The estimates for 2022 and 2023 were $65.17 and $70.18, respectively. The S&P 500 Index's dividend
yield was 1.67% as of 7/8/22, up from 1.27% on 12/31/21.
6. A dividend payout ratio of 60% or less is typically a good sign that a dividend distribution is sustainable, according to The Motley Fool. A dividend payout ratio
reflects the amount of money paid out as a dividend relative to a dollar's worth of earnings. In Q2'22, the payout ratio on the S&P 500 Index was 36.80%.
.


